Transcript of Temasek Review 2014 Media Conference
Small parts of this transcript have been edited for readability. No material change has been made. The transcript should be read in conjunction with the slides. The slides precede the discussion relating to them.
STEPHEN FORSHAW: Good afternoon, ladies and gentlemen, my name's Stephen Forshaw, I'm pleased to be your MC for this afternoon. Just before we kick off the presentation, can I just start with a few housekeeping announcements? I'm sorry I always have to start with housekeeping! A reminder today that we are under embargo until 3pm. That's not 2:59pm, that's 3pm and I will go by the pips on the BBC!
We have a panel presentation today around the three pillars of our charter – investor, institution and steward. Our panellists presenting today are three members of our senior leadership team, Mr Rohit Sipahimalani, Mr Wu Yibing and Ms Pek Siok Lan. When we get to the Q&A session this afternoon could I ask that you use the microphone and identify yourself by name and organisation so that we have the details for the transcript and also so our media panellists know who you're talking to or who they're talking to. Can I also just ask that you turn your phones to silent. If you need to receive or make calls, please leave the room because it can be quite distracting for the panellists. Also, a reminder that our reporting currency is Singapore dollars so all the figures you see today are Singapore dollars unless otherwise mentioned. We have the 31 March 2014 exchange rates for you in the media pack that you have there. After 3pm today we will be tweeting details of our results so you can also follow us on Twitter at Temasek and the hashtag is #TemasekReview. So without any further ado, please allow me to introduce the first panellist to speak this afternoon, Mr Rohit Sipahimalani.
ROHIT SIPAHIMALANI: Good afternoon, ladies and gentlemen, and welcome to the 11th edition of our Temasek Review. My name is Rohit Sipahimalani and I will be sharing with you details of our financial performance. But it looks like you have already stolen our thunder. Many of you have already written articles talking about estimates of our returns and our financial performance for the year and I must say, you have been reasonably accurate. I must congratulate you for that, but we should also get a little bit of credit for being transparent with our portfolio.
Anyway, as you have pointed out, our returns for the year were moderate, driven by the weakness in our key markets in Asia. We, however, saw the weakness in the markets as an opportunity to significantly step up our investments. Last year was the most active year for us in terms of new investments since the global financial crisis. We also opened offices in the US and Europe and stepped up activities of our Enterprise Development Group, which is focused on building new businesses.
The world is being driven by ideas and innovation, and we see a lot of exciting opportunities before us in the midst of the obvious challenges. We are working to respond to these opportunities and shape our portfolio to generate long term sustainable returns.
Temasek is all of 40 years old. We have a lot to do; our journey has just begun.
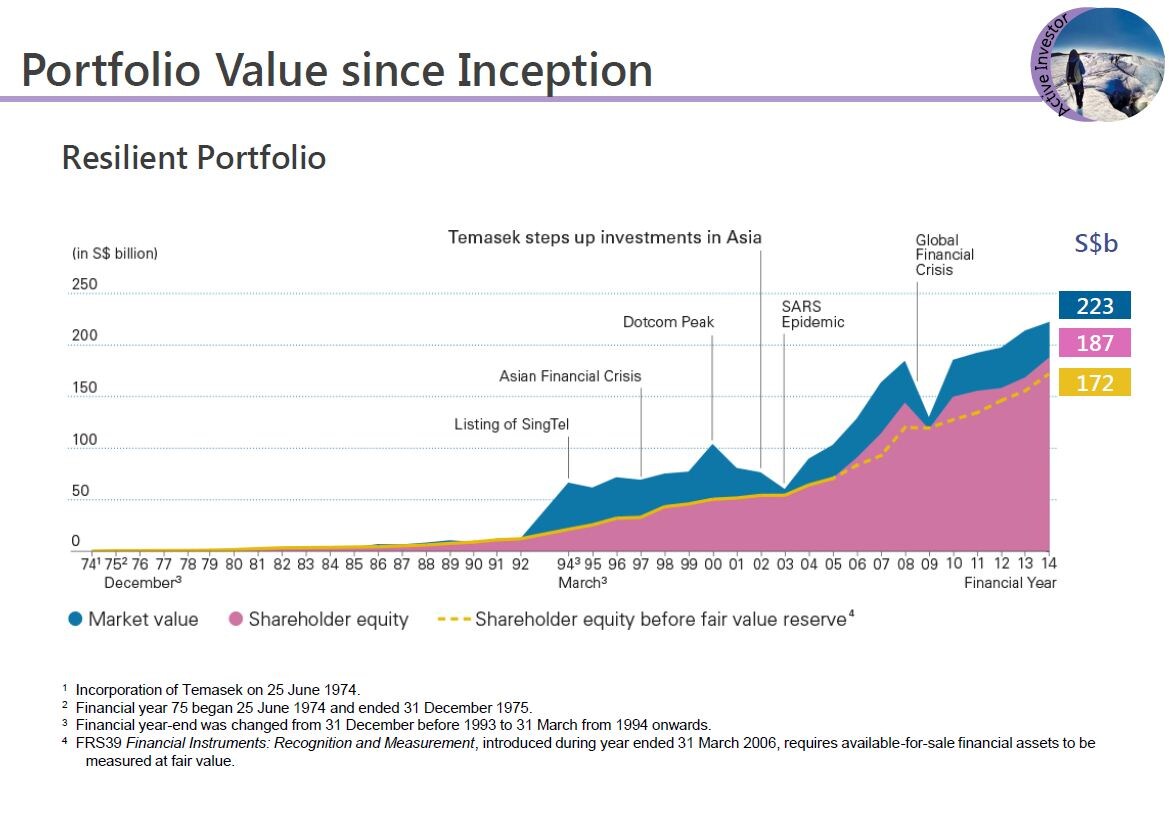
We ended last year with a portfolio value of S$223 billion up from S$215 billion last year. This chart shows you the value of our portfolio since inception. The blue shaded area shows you our portfolio by market value, which as you can see, is quite volatile with year to year changes in the markets. The pink area shows the value of our portfolio by shareholder equity, which reflects more the underlying profitability of our group companies. You will notice though that the pink area has started moving in tandem with the blue since 2006 and that was because of a change in the accounting standards from 2006 which required us to mark to market that portion of our portfolio where we owned less than 20% stakes and adjust those mark to market gains or losses directly against shareholder's equity.
So we've also drawn out here the yellow dotted line which shows you the value of our shareholder equity without the mark to market adjustments and you can see that is much more steady and rising over time in line with the profitability of our portfolio companies.
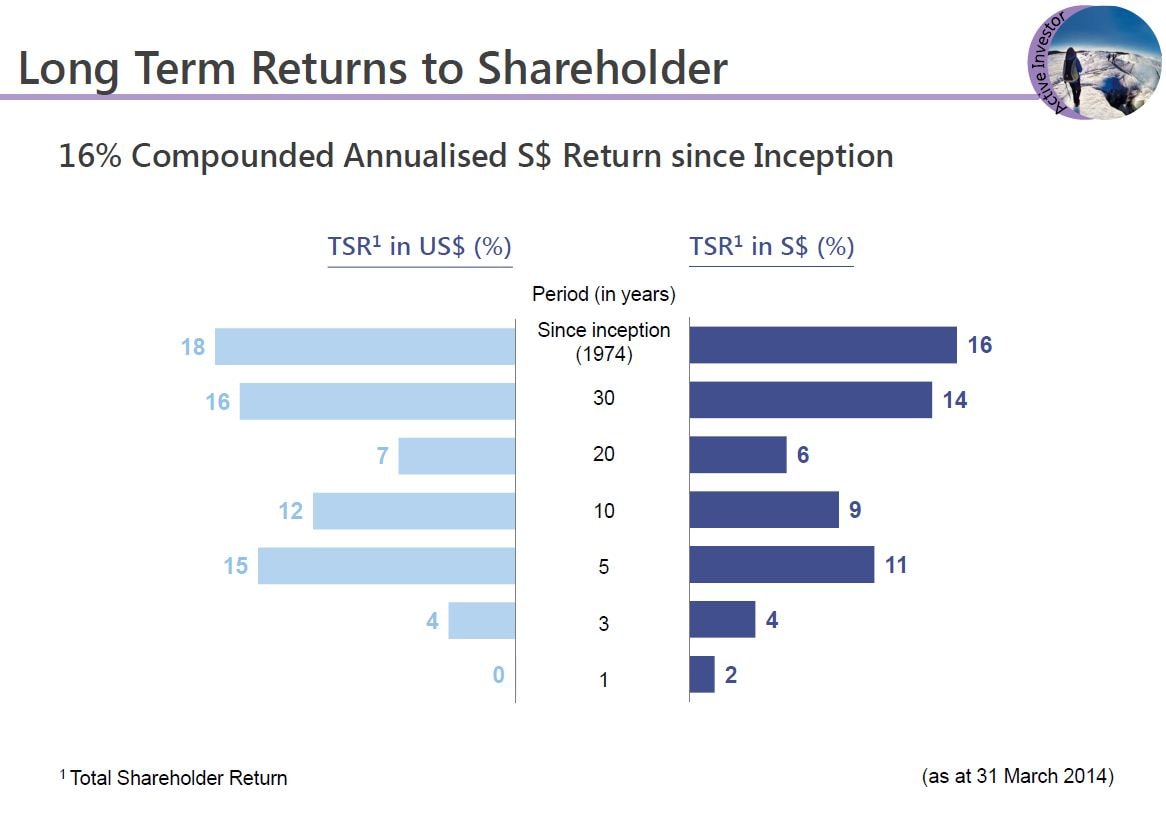
Now, as a long term investor, we focus on long term returns. This chart provides you Total Shareholder Returns, or TSR, across various time periods so that you can look at our performance across different time horizons. Our one year TSR in S$ terms was 1.5%. Our 5-year TSR was 11% and our 40-year TSR since our inception has been 16% per annum in S$ terms.

Now the following slide shows you our rolling TSRs over the last decade over 1, 10 and 20-year horizons. The 1-year TSR, as shown by the light blue line, is obviously quite volatile, reflecting the annual volatility of the markets. But as a long term investor, we believe our longer term TSRs for 10 and 20 years as shown by the orange and purple lines are a more accurate reflection of our performance and you can see those returns have been much more stable over time. You will notice though that there's been a decline in the 20-year TSR in 2014 to 6% and that is because the base year of 1994 was somewhat inflated due to the SingTel IPO pop post its listing in November 1993.
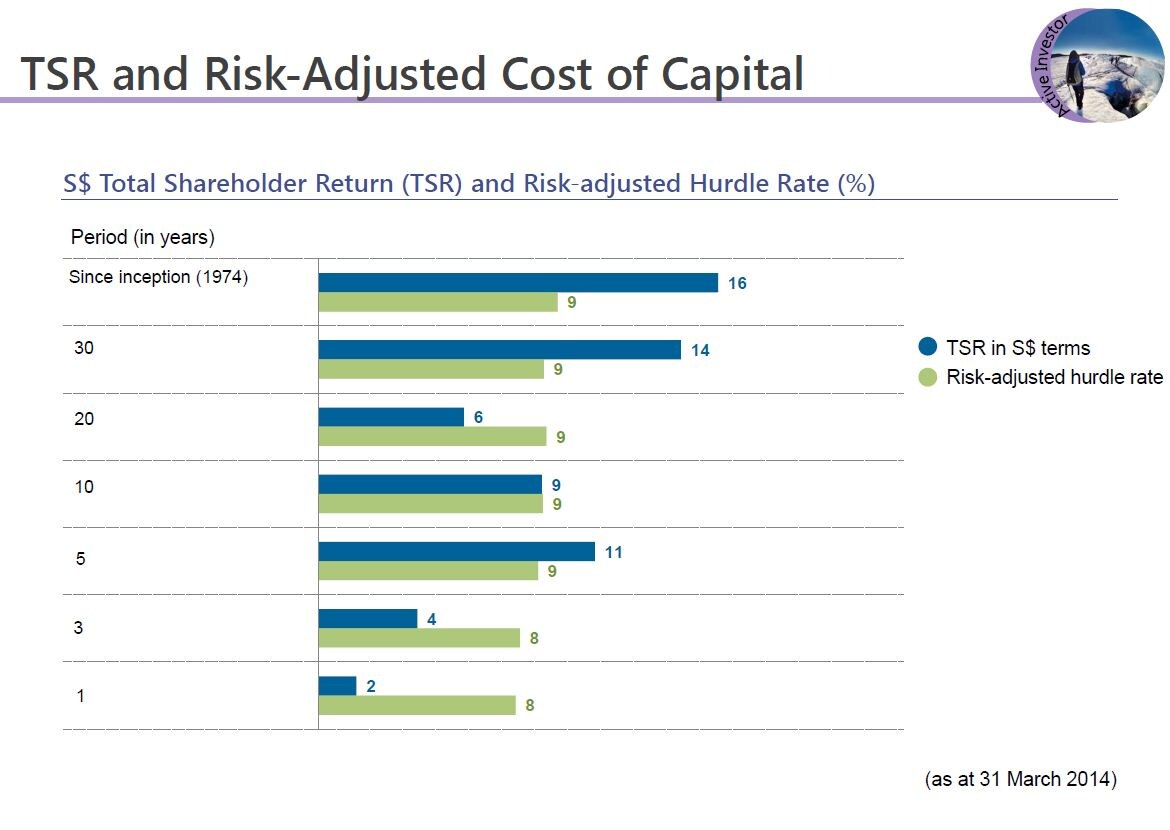
Now, we evaluate our performance by comparing our TSRs with our risk-adjusted hurdle rates which we refer to as our cost of capital. The blue bars here show Temasek's returns over different time periods and the green bars show our cost of capital over the same time periods. This chart shows that for most periods of 5 years or more, Temasek's returns have been higher than our cost of capital. Our cost of capital has typically been in the 8 to 9% range. It's however, calculated on a bottom up basis and is a weighted average of the risk-adjusted hurdle rates of all our individual investments. Over the last one year, our returns were impacted by the weakness of our key markets in Singapore and China. Our return of 1.5% last year was therefore less than our cost of capital of 8% for the year.
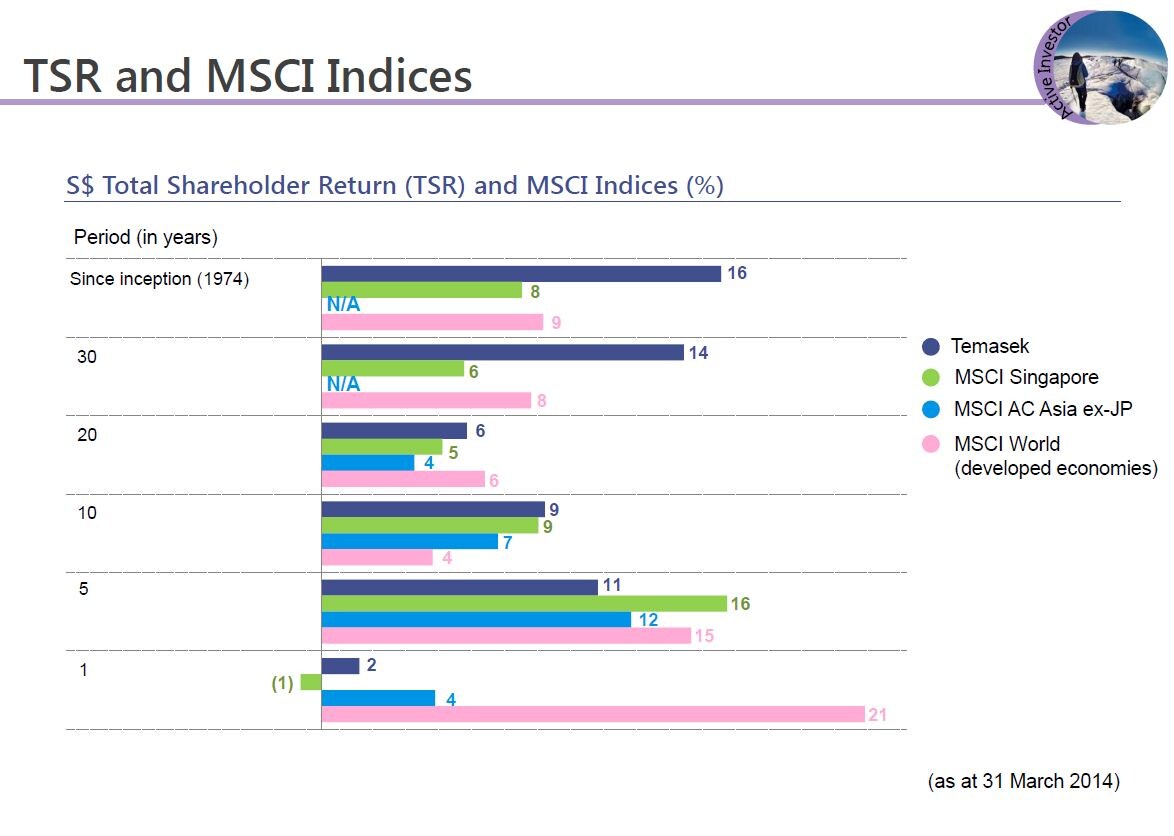
Now this chart you can see the blue bars, which is as I've shown you earlier on our returns over different time periods. Now we are not a fund manager and don't benchmark our performance against public market indices but we’re often asked for comparisons so you can treat this as one frame of reference. You can see here that for longer periods of 10 years or more, Temasek's returns have consistently outperformed all the market indices. Now our 5-year returns are calculated off 2009, which was the depth of the financial crisis. Now during the GFC, Temasek's portfolio declined much less than most of the market indices and accordingly, the rebound from that low base was also lower than that of the market indices.
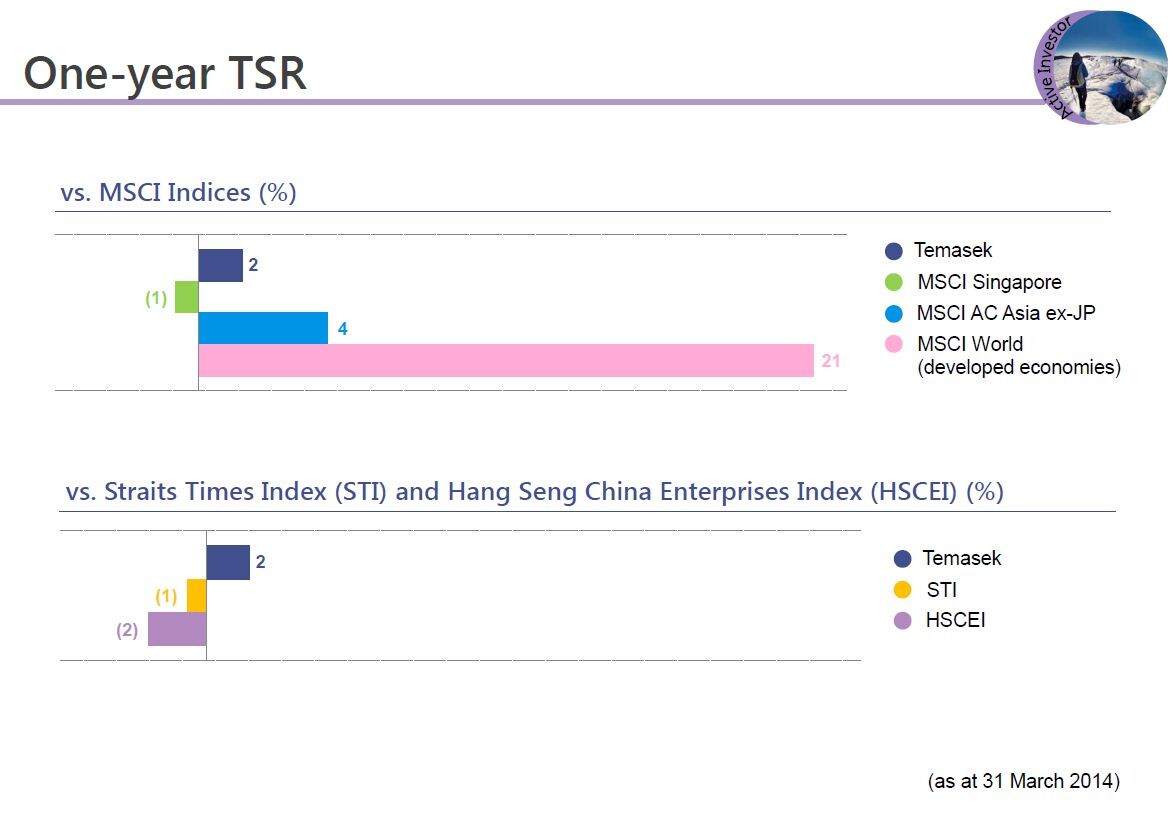
Let's now look at the 1-year returns. Over the last year our returns were higher than that of MSCI Singapore, which are negative returns, but lower than that of MSCI Asia-ex Japan and MSCI World. Let's try and put that in some context. As the bottom half of this chart shows both the STI and the Chinese H-shares index in Hong Kong had negative returns last year. Now, about half of our entire portfolio consists of listed securities in Singapore or Chinese H-shares in Hong Kong and therefore this obviously had an impact on the overall value of our portfolio. By the way, as an aside, both the STI and the HSCI have returned and rebounded about 4 to 5% since March 31st 2014 and all it does is emphasise the fact that as a long term investor we have to be prepared to absorb short term mark to market volatility.
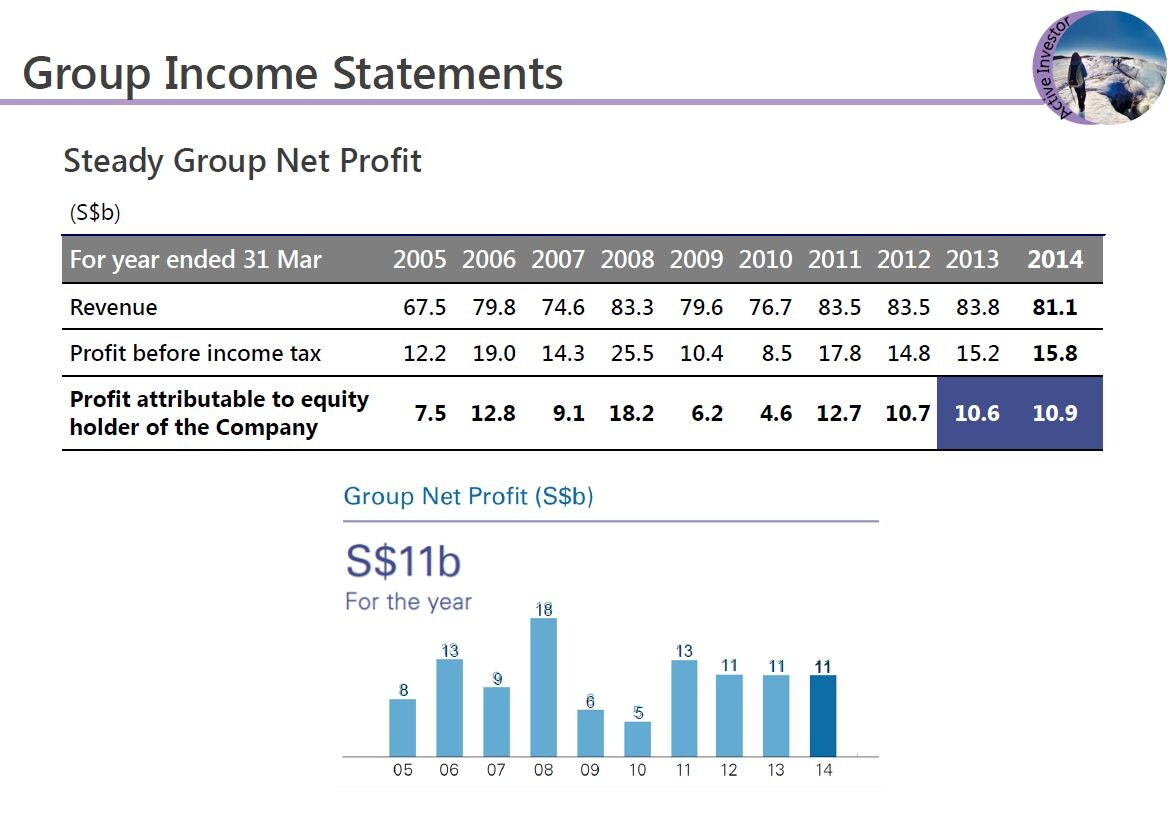
Let me now move to our group financial performance. The Temasek Group financials are a line-by-line consolidation of Temasek and our operating subsidiaries. So our Group revenues include the revenues of listed subsidiaries like SingTel as well as unlisted subsidiaries like PSA. The Temasek Group net profit consolidates the profits of our underlying operating subsidiaries as well as reflects the gains and losses from our direct investment activities. Our Group net profit for the year was S$11 billion, similar to that for the year ended March 2013.
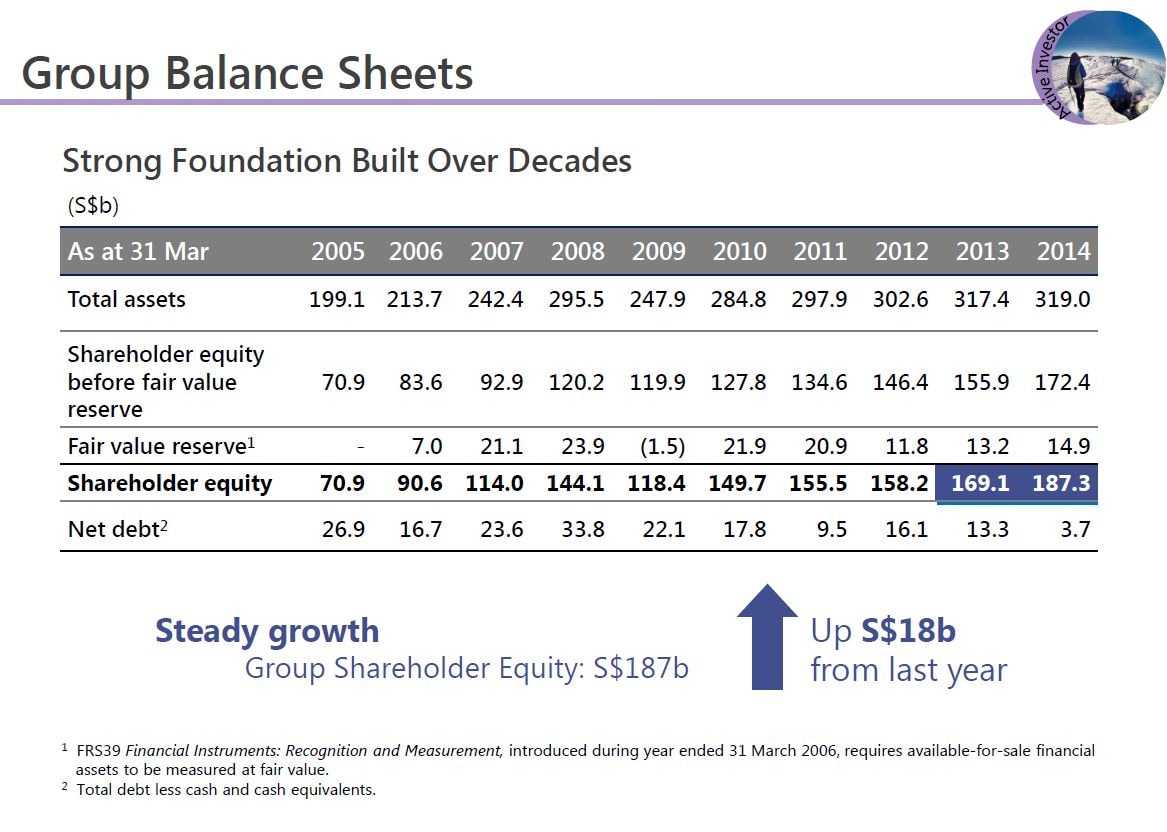
Coming to the Group balance sheet, the balance sheet highlights the strength of the Temasek Group and consolidates the balance sheet of all of our subsidiaries. Temasek's Group shareholders’ equity last year was S$187 billion, up S$18 billion from the previous year. This was primarily due to the profits of the underlying portfolio companies during the year. But it also included a net capital injection of almost S$5 billion from our shareholder, which was made as part of their own capital allocation decisions.
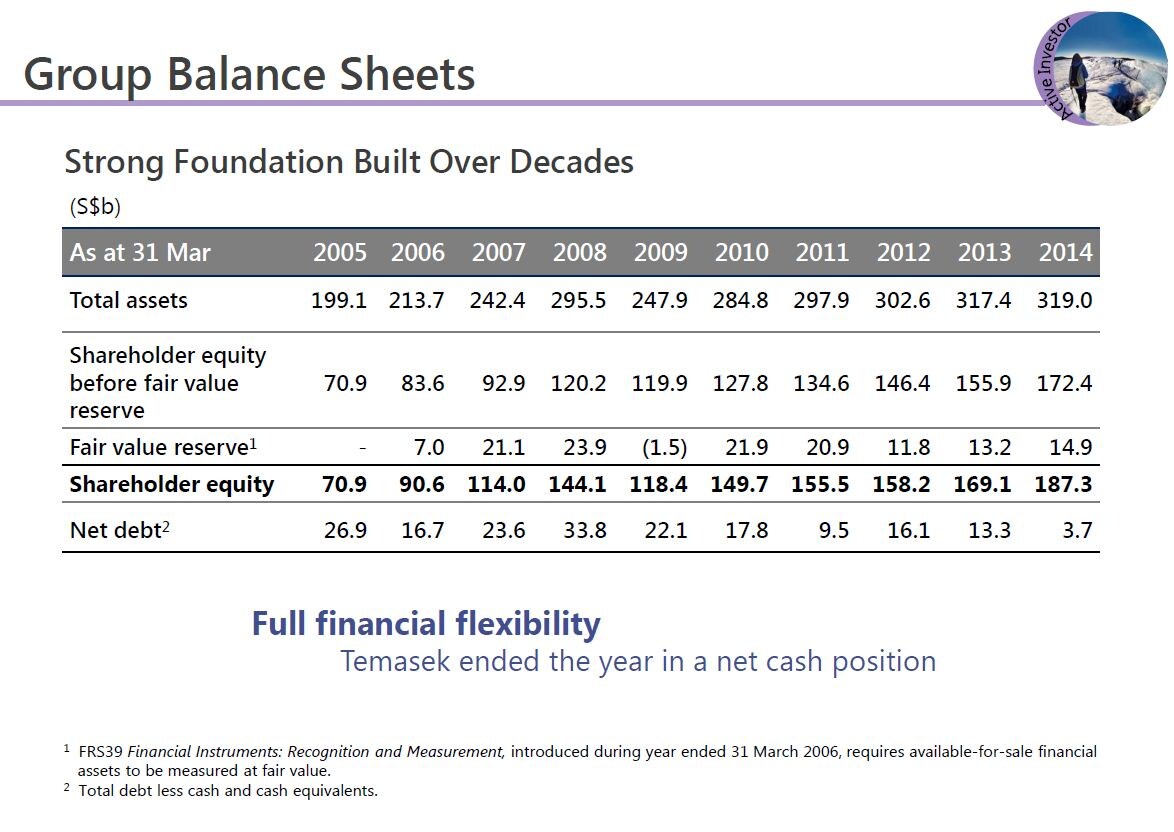
Looking at our consolidated net debt, we ended the year with a consolidated net debt of $3.7 billion. However, if you look at Temasek itself as a standalone entity, we ended the year in a net cash position, even excluding the capital injection from our shareholder. And this gives us the financial flexibility to step up our pace of investments, to take advantage of specific opportunities.
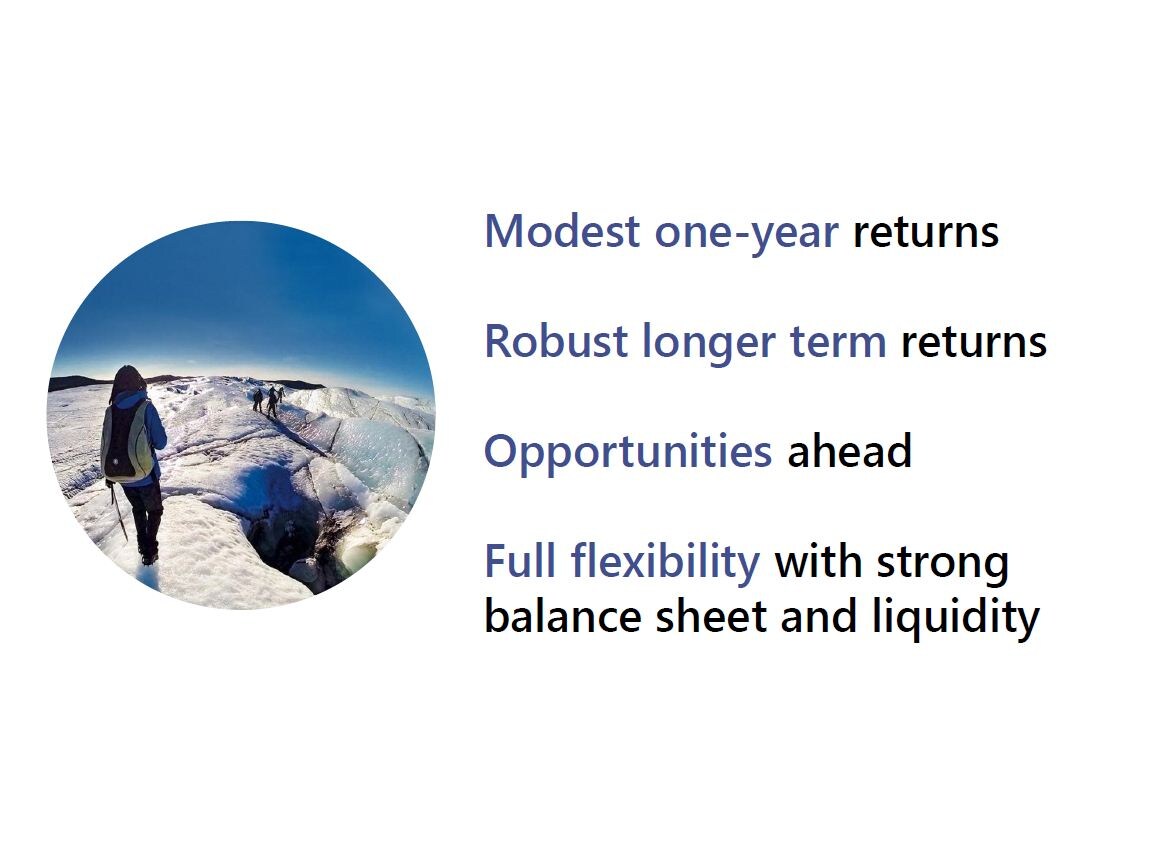
So in summary, our returns for the year were modest reflecting the weakness in Singapore and China. However, our long term returns continue to be robust. Our 5 and 10-year returns have met or exceeded our cost of capital. We are excited with the opportunities we see and we see many of them ahead of us and we believe that our strong balance sheet and liquidity gives us full financial flexibility to respond to these opportunities. I will now hand over to Yibing to talk about our portfolio and strategy.
WU YIBING: Good afternoon, everyone. My name is Wu Yibing. I joined the team last year as head of China. In line with our tradition as the new kid on the block, I'm drafted to represent Temasek today. I'm thankful because this gives me a great opportunity to get familiar with the great crowd here.
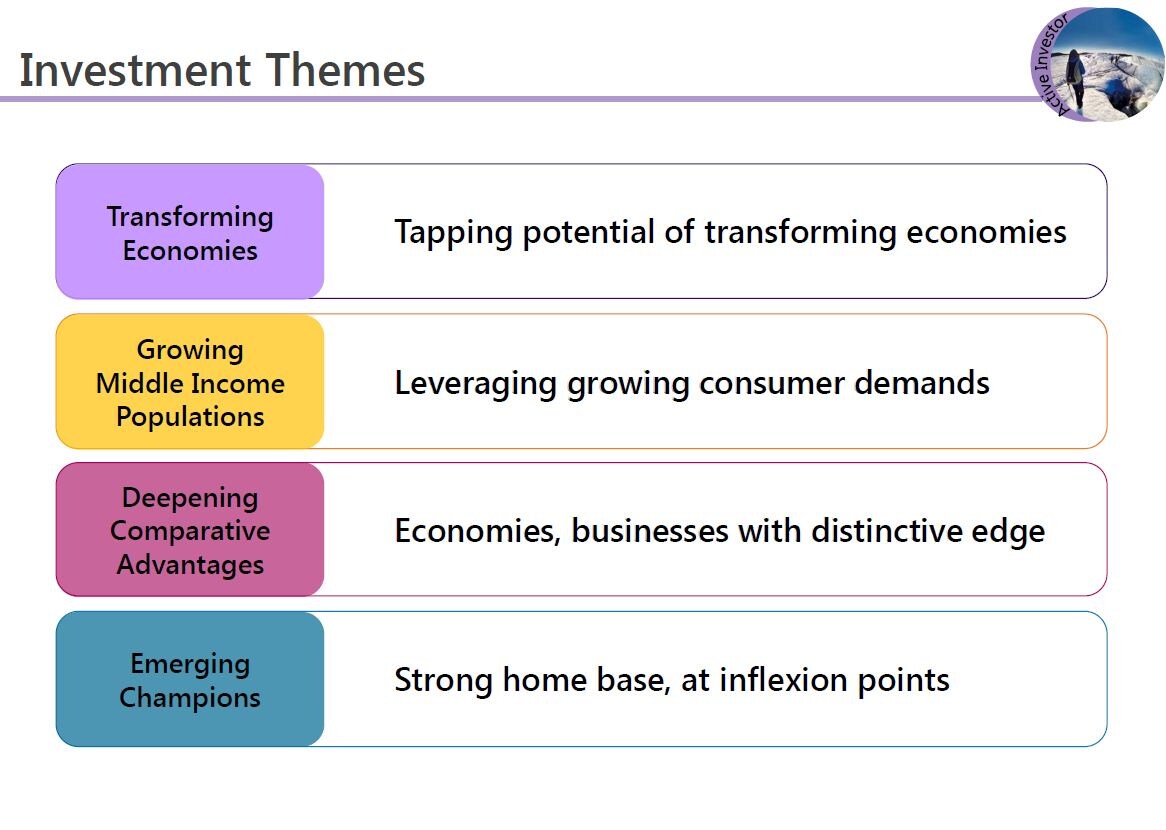
Let me start by sharing our investment strategy. We have four investment themes. They have been consistently guiding our investments over the last decade. These themes emphasise future long term trends. They are as relevant today as ever. For the first theme, transforming economies, we tap the potential of transforming economies such as China and India and we have been actively investors in these markets for quite some years.
For the second theme, we leverage the growing middle income consumer. Our investments in consumer products as well as real estate are good examples.
The third theme, we seek out economies, businesses and companies with distinctive advantage in intellectual property or other competitive advantage. An example would be our investment in life sciences.
The fourth theme, we're looking to investing in companies that have a strong home base or at inflection points. These companies have the potential to become regional or global champions. In the next few pages you will see how these themes have guided our investment over the years and shaped our portfolio mix.
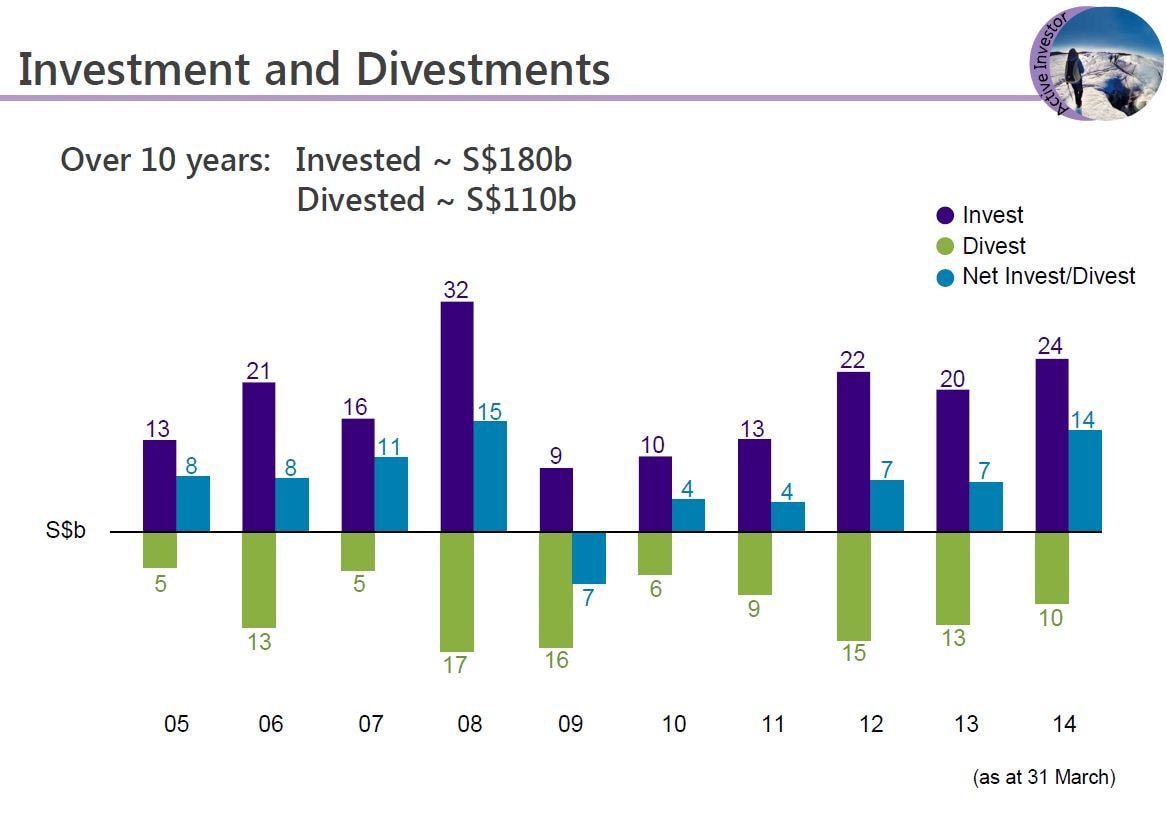
This slide shows our investment and divestment activities for over the last 10 years. We are an active investor. Over the last decade we have invested almost S$180 billion and divested nearly S$110 billion. Last year was one of the most active years in investment, the most active since global financial crisis in 2008. Our net investment was S$14 billion. We invested $24 billion and we divested $10 billion.
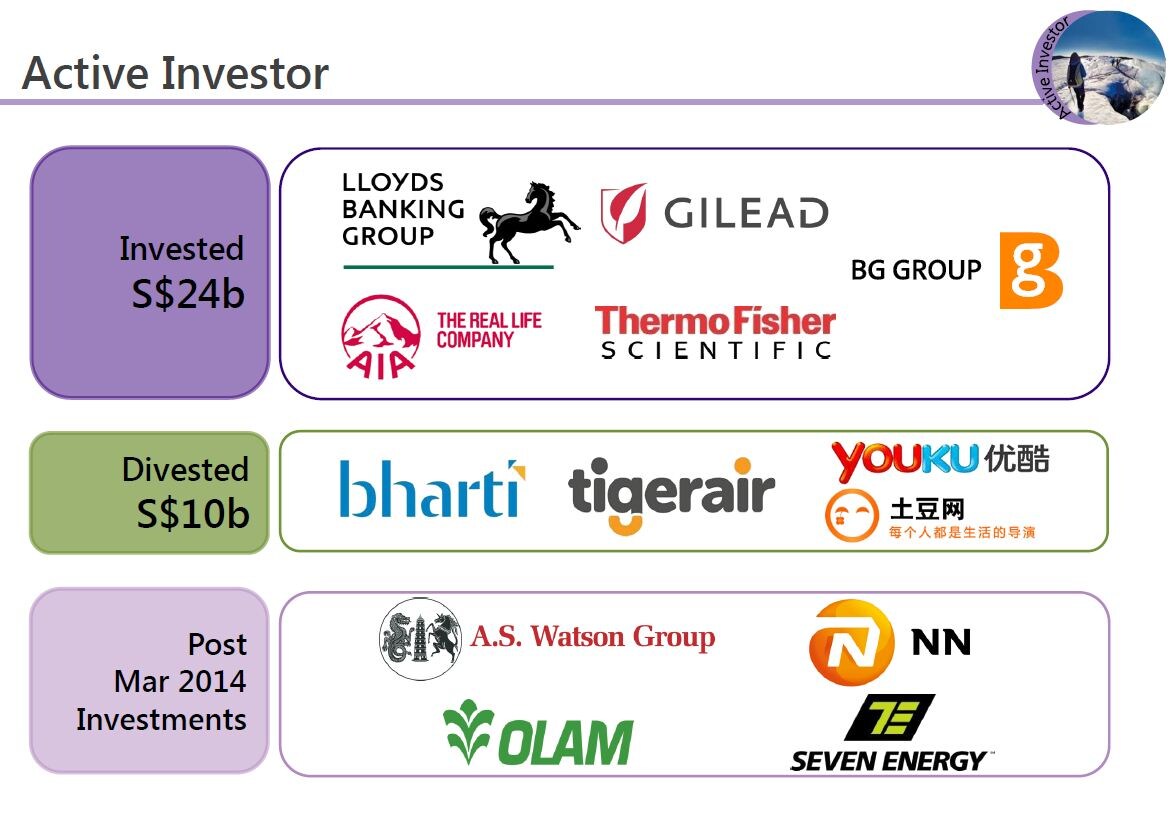
Now let's look at some examples of our key investments and divestments. During the year we invested across sectors and geographies. Within financial services we invested in Lloyd's Banking Group, the largest domestic UK bank by assets. Investments into financial institutions also expanded into non-banking subsectors, most noticeably insurance. For example, we invested in AIA Group, the largest independent pan-Asia insurer. Within life sciences sector in the US we invested in Gilead Sciences a biopharmaceutical company which specialises in developing novel therapies for infectious disease and cancer. Also we invested in Thermo Fisher, a global market leader in lab tools and consumables. This name reminds me of my years in the lab as a lab rat. Both of these companies are examples of our investment of deepening competitive advantage. In the energy space we invested in the BG Group, a UK listed oil and gas company.
Divestments were also across various sectors and geographies. Examples would include Bharti Telecom, Tiger Air and Youku-Tudou. Post March 2014 year end some key investments include A.S. Watson, a global health and beauty retailer with over 10,000 retail outlets in Asia and in Europe and a general offer for Olam, a global supply chain manager and food processor and agricultural products processor. Both these investments increase our exposure to the consumer sector and fall under our investment themes of growing middle income populations and transforming economies. We also made investments in NN Group, a Dutch insurance company and Seven Energy, an oil and gas producer in Nigeria.
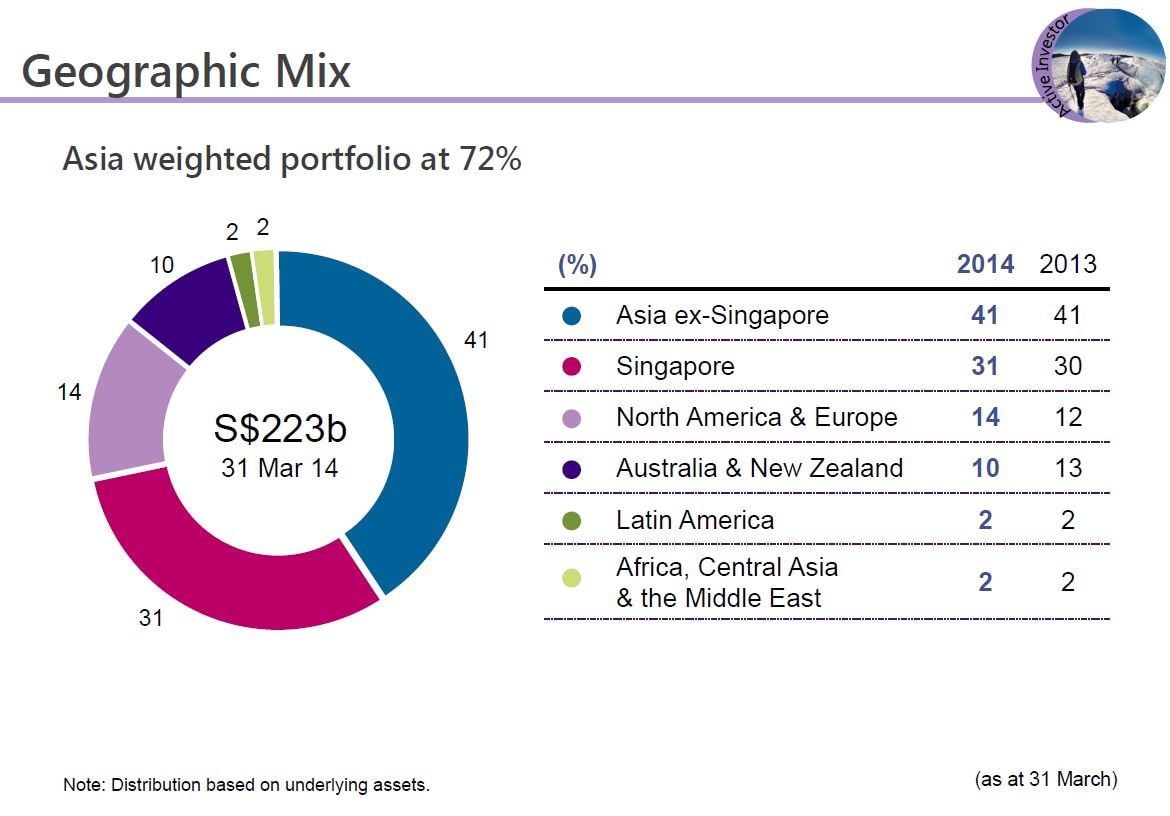
Over the next few slides, I will show you our portfolio shape at financial year end from different perspectives. You will notice that our portfolio remains relatively stable year over year. This should not be surprising as we remained steady on our investment themes and investment strategy. This chart shows the geographic distribution for our portfolio by underlying assets. We remain anchored in Asia. We ended the year with 72% of our portfolio exposure to Asia, including Singapore. This is because we continue to see long term growth potential in Asia and the softer markets gave us opportunity to add on our positions, especially in China.
While we remain anchored in Asia, we have increased our exposure in North America and Europe from 12% to 14% of our portfolio over the last year. This is driven by our new investments across sectors including life sciences, financial institutions and technology, media and telecom.
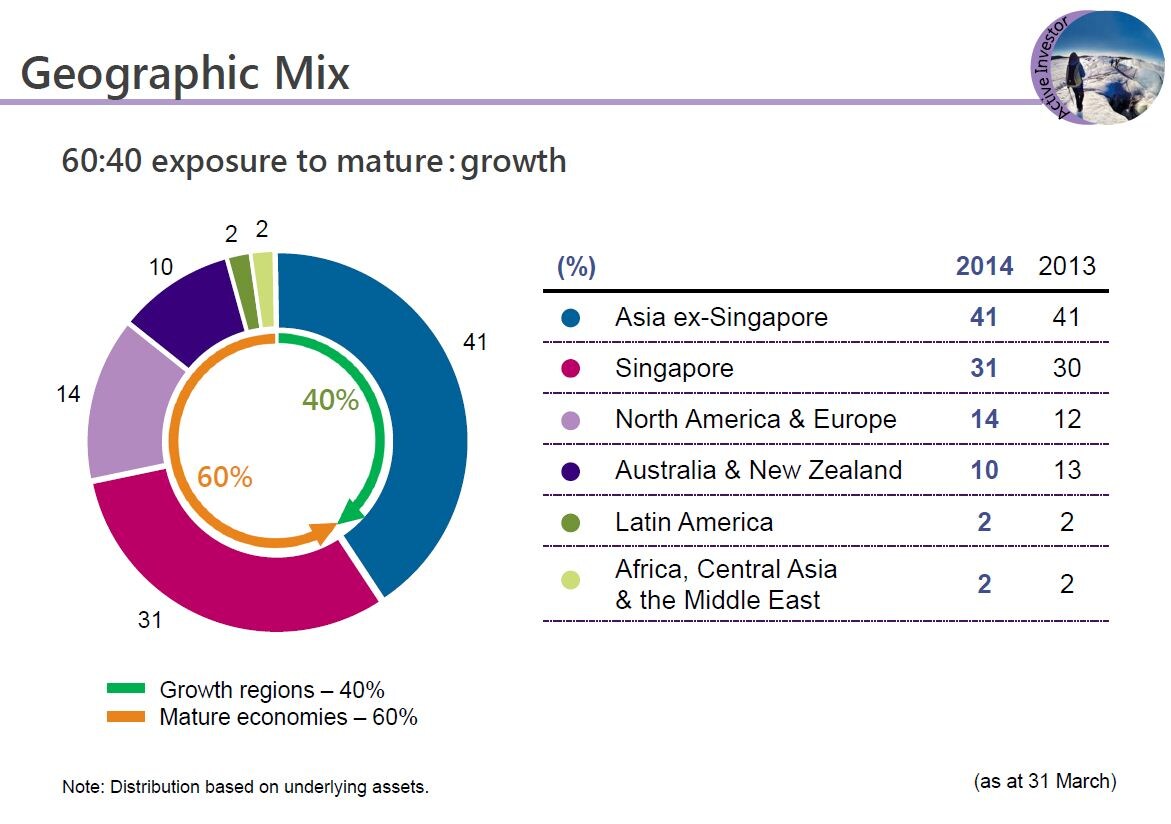
As you can see from the green and orange arrows, our portfolio is more or less balanced between the growth regions at about 40% and mature economies at about 60% of our portfolio.
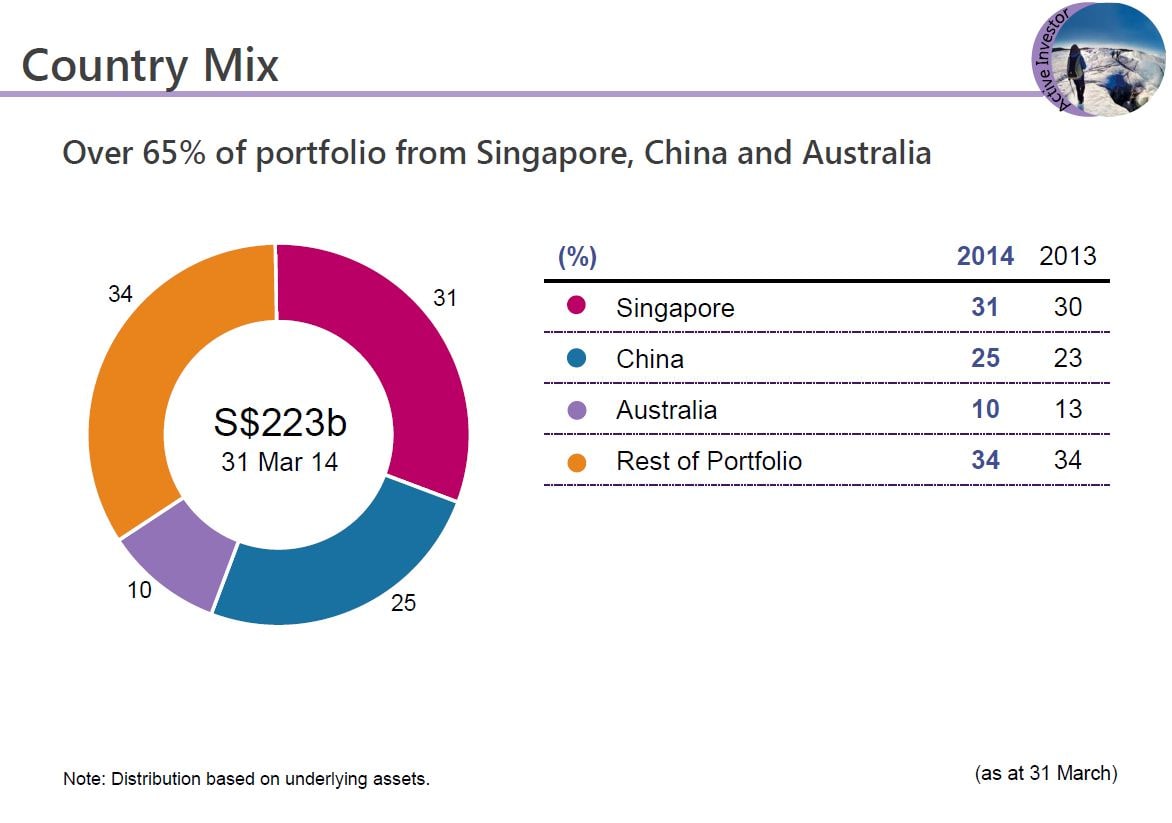
The next slide provides you more colour of our top three countries of exposure. Singapore remained close to a third of our portfolio over the last 7 years. This is down from 50% over 10 years ago. China is the second largest, constitutes 25% of our portfolio as we took opportunity of the market weakness there to add to our position.
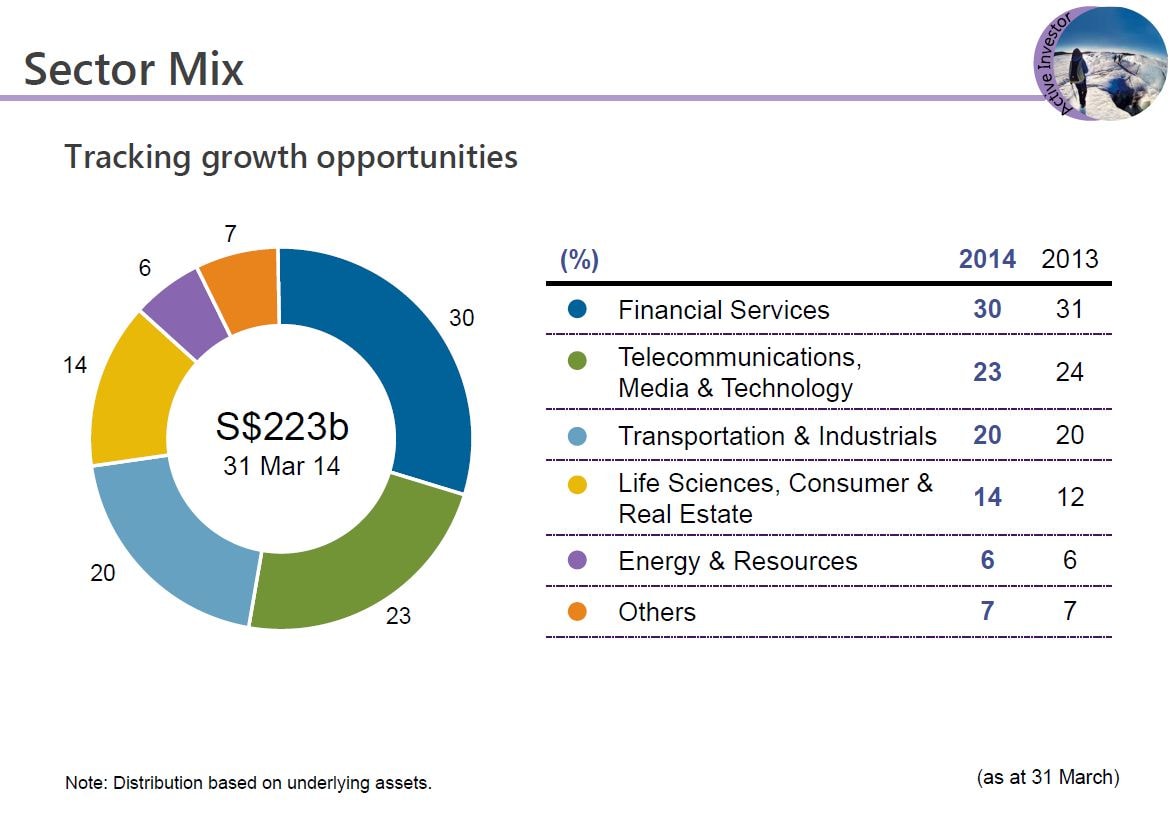
Now, let's look at the sector view of our portfolio. Our investments are diversified across a range of different sectors. We made significant net investment into our financial services sector but this was offset by a decline in market value due to volatility in bank stocks. As of 31 March 2014, financial services remained our largest sector of exposure at 30%. Life sciences, consumer real estate grew from 12% to 14% as we made significant investments in the likes of Gilead Sciences and Thermo Fisher. If we would include our investments in Watsons and Olam post year end, consumer sector would grow to an even bigger share of our portfolio.
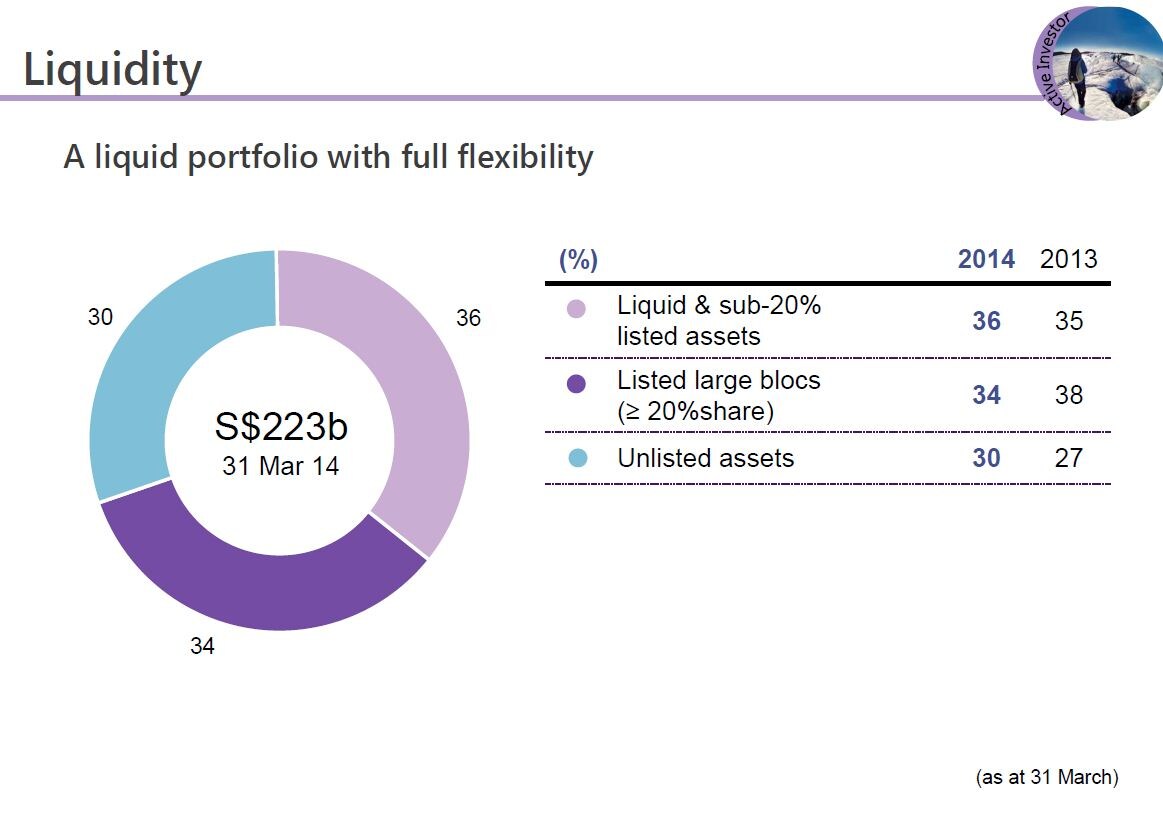
Let's now look at our portfolio from liquidity perspective. Our portfolio remains very liquid with 70% of our portfolio in liquid and listed assets. We have full flexibility in seeking investments with the best return, regardless it's listed or unlisted.
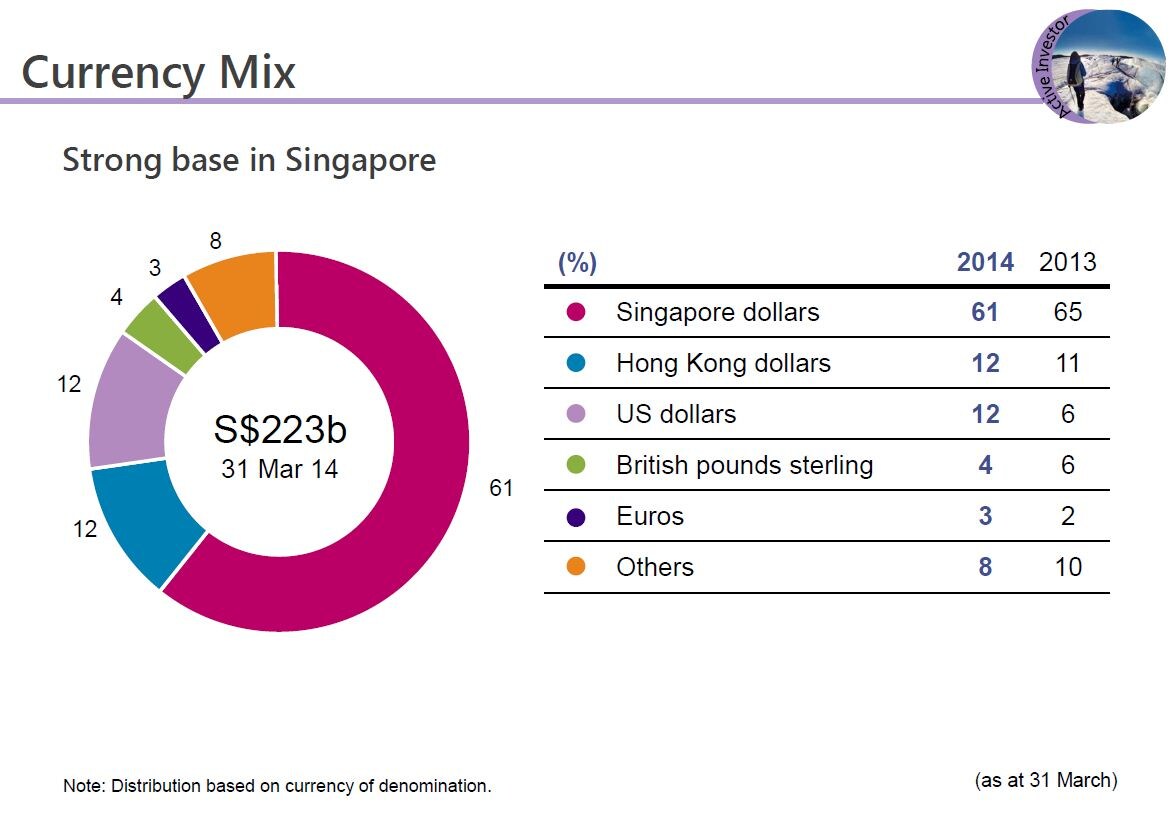
Now let's look at our portfolio breakdown by currency based on the currency of denomination. We have strong base in Singapore. 61% of our portfolio is denominated in Singapore dollars.
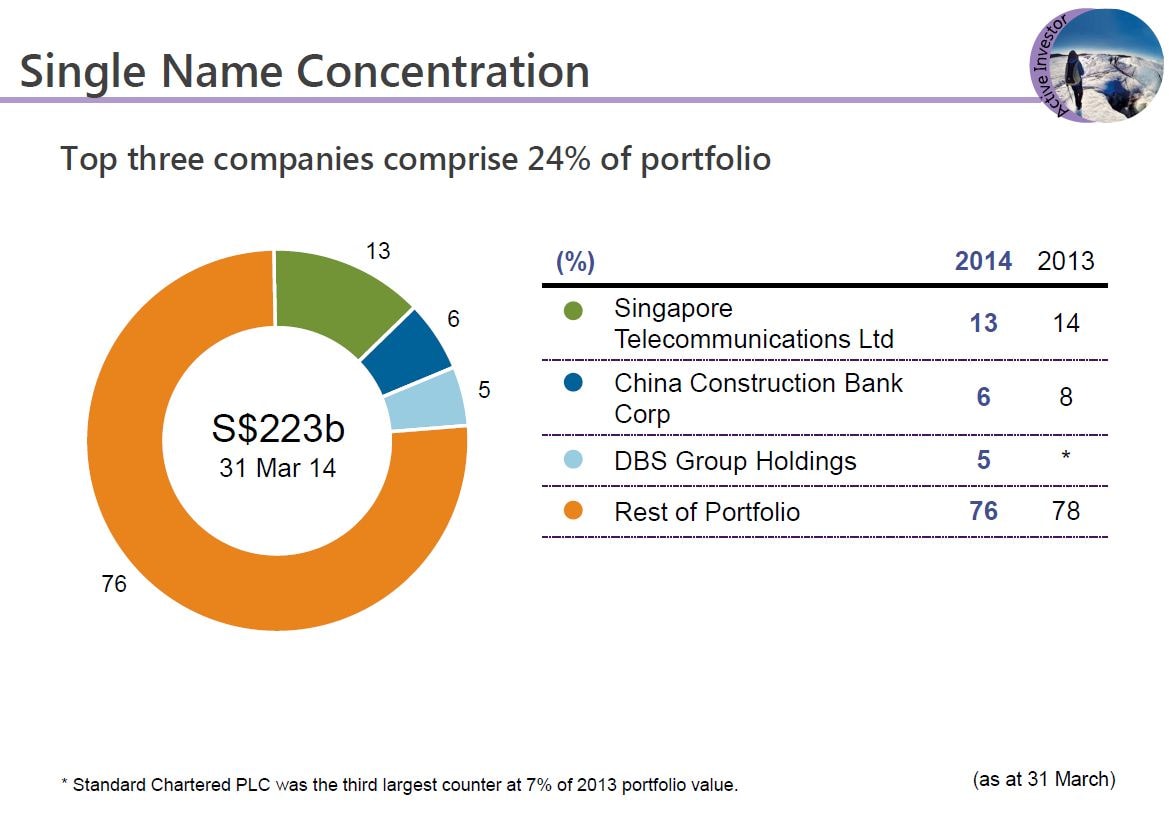
This year SingTel remained our largest single name exposure comprising 13% of our portfolio, down from 14% last year due to increase in the overall portfolio size. 10 years ago, SingTel would represent 30% of a much smaller portfolio of $90 billion. China Construction Bank remained as the second largest single name exposure at 6% of our portfolio, while DBS replaced Standard Chartered as the third largest single name exposure at 5% of our portfolio.
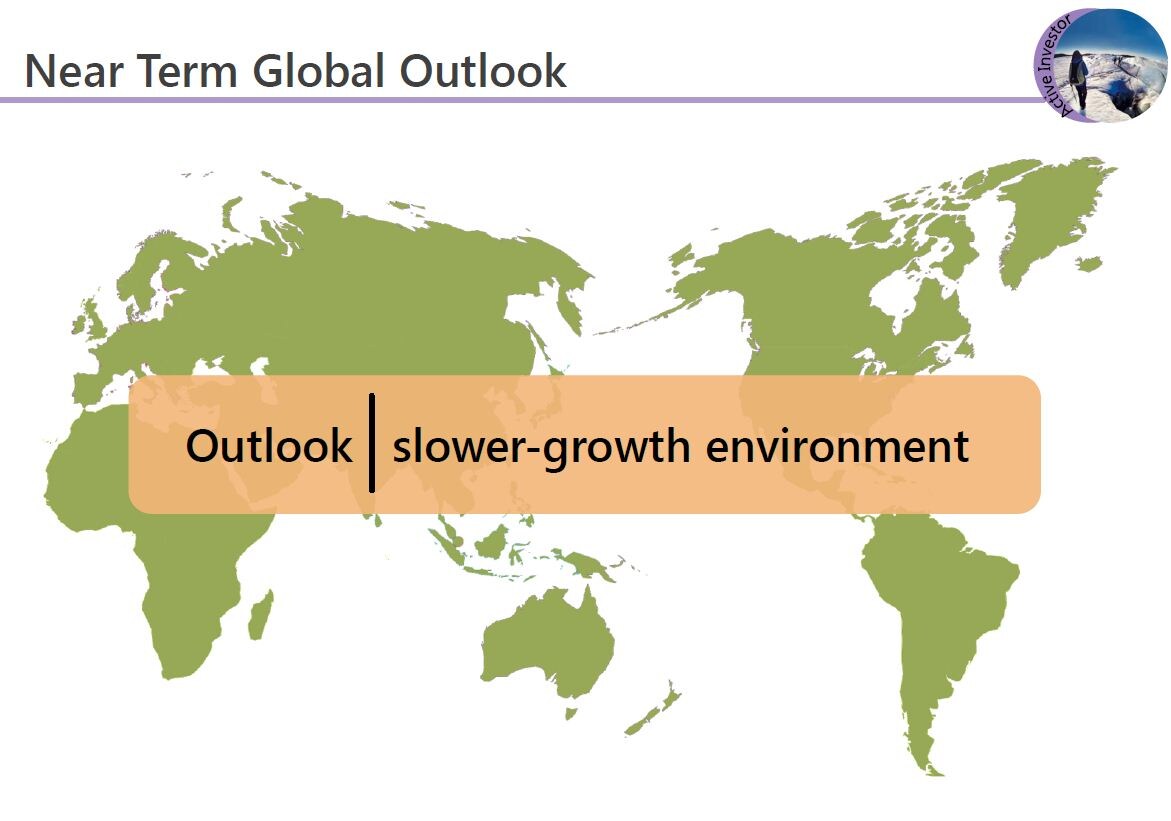
Let's now turn to a near term global outlook. On the whole, we think the outlook is a slower growth environment in many markets and the financial markets would continue to be volatile. We believe that we will continue to find good investment opportunities in such an environment.
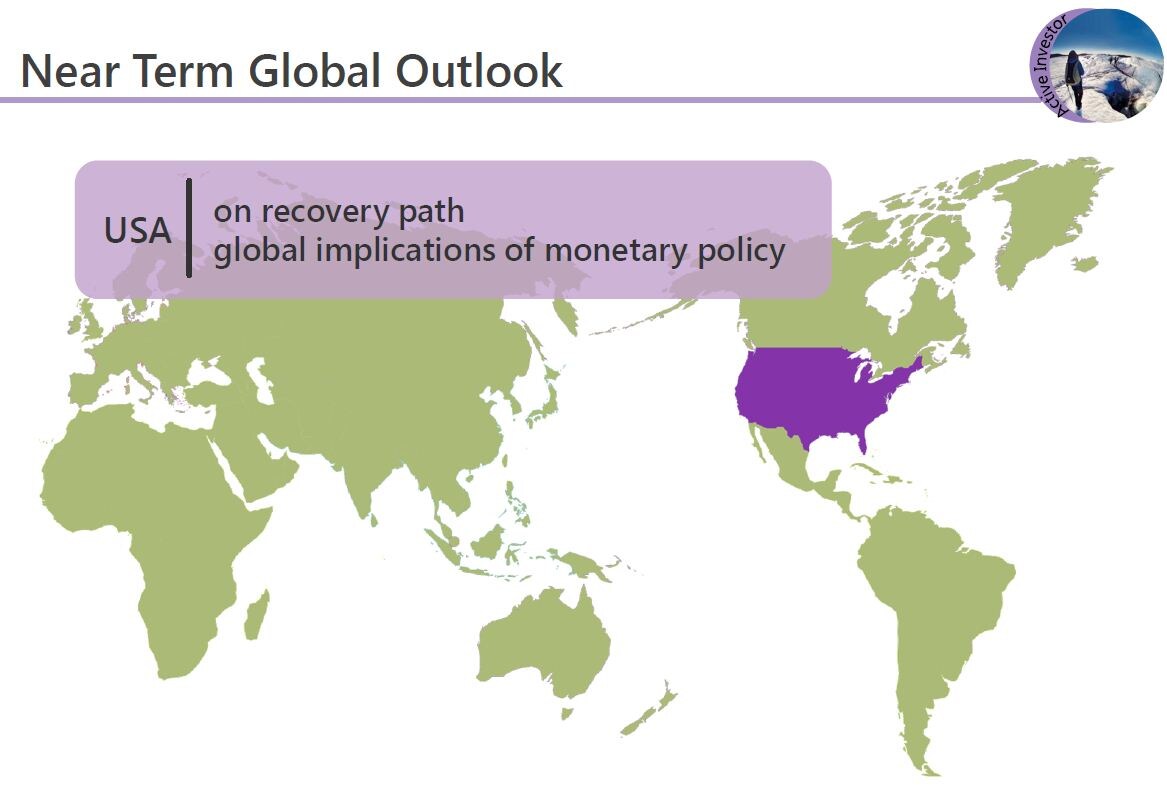
Firstly, on the US, the economy is improving and should continue to grow at a slow pace. Unlike last year, the recovery of the consumer confidence it's increasing and removal of the fiscal drag contributed to the overall growth as well. Job addition has been strong this year. However, this will lead to eventual tightening of the monetary policy which would have consequence for many markets and economies.
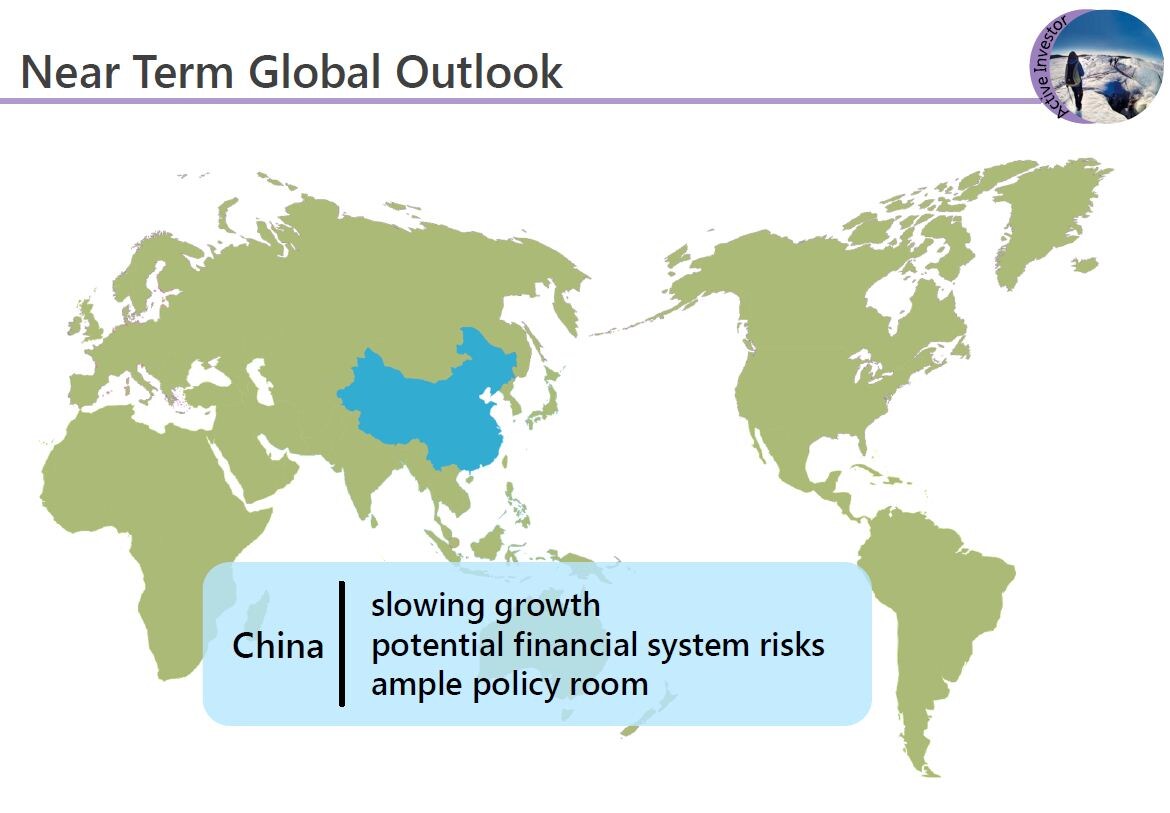
On China, the growth rate is slowing, although we would see it stabilising around 7%. There are some risks in the financial system however the Chinese Government has ample policy room and political will to deal with these challenges. Most importantly, the structural and market reforms will bring longer term benefits to the country and to the economy, although it might also bring some short term disruptions. This will present opportunities for long term investors such as Temasek.
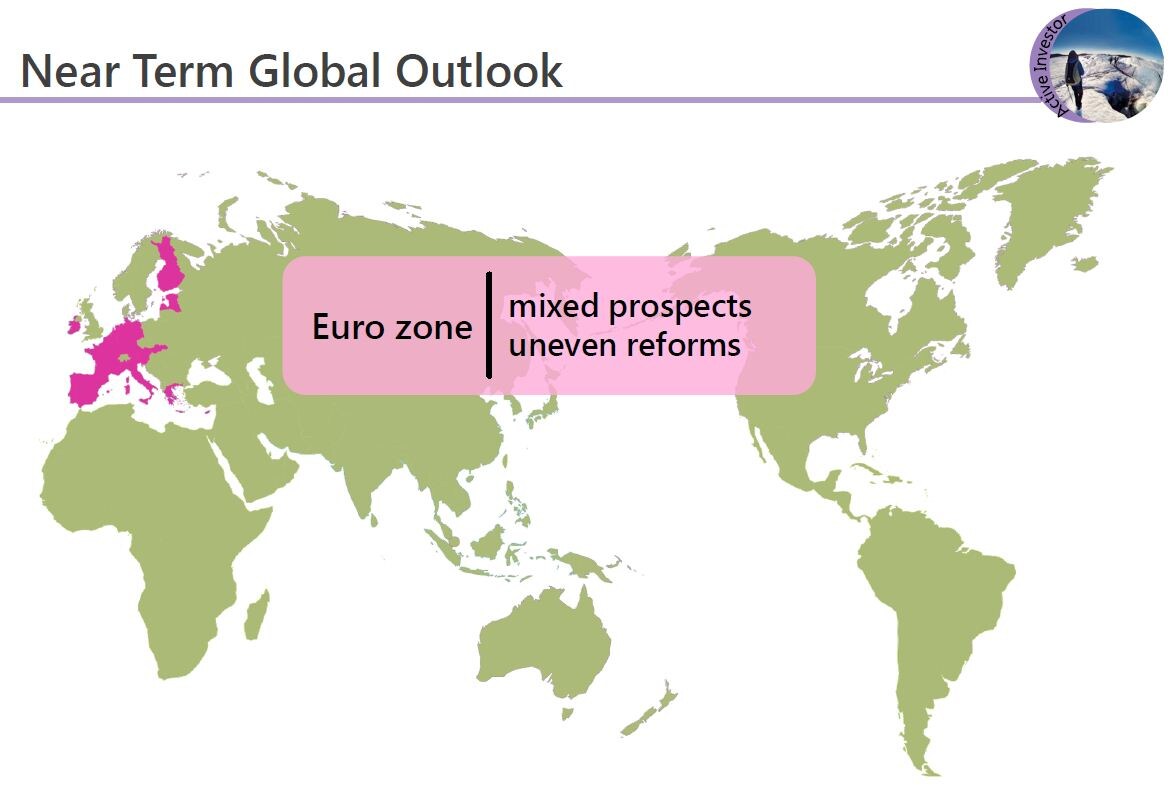
On Europe, we believe the tail risks have reduced significantly. However, the continued deleveraging coupled with fiscal austerity, we would expect weak conditions in Europe for some time to come.
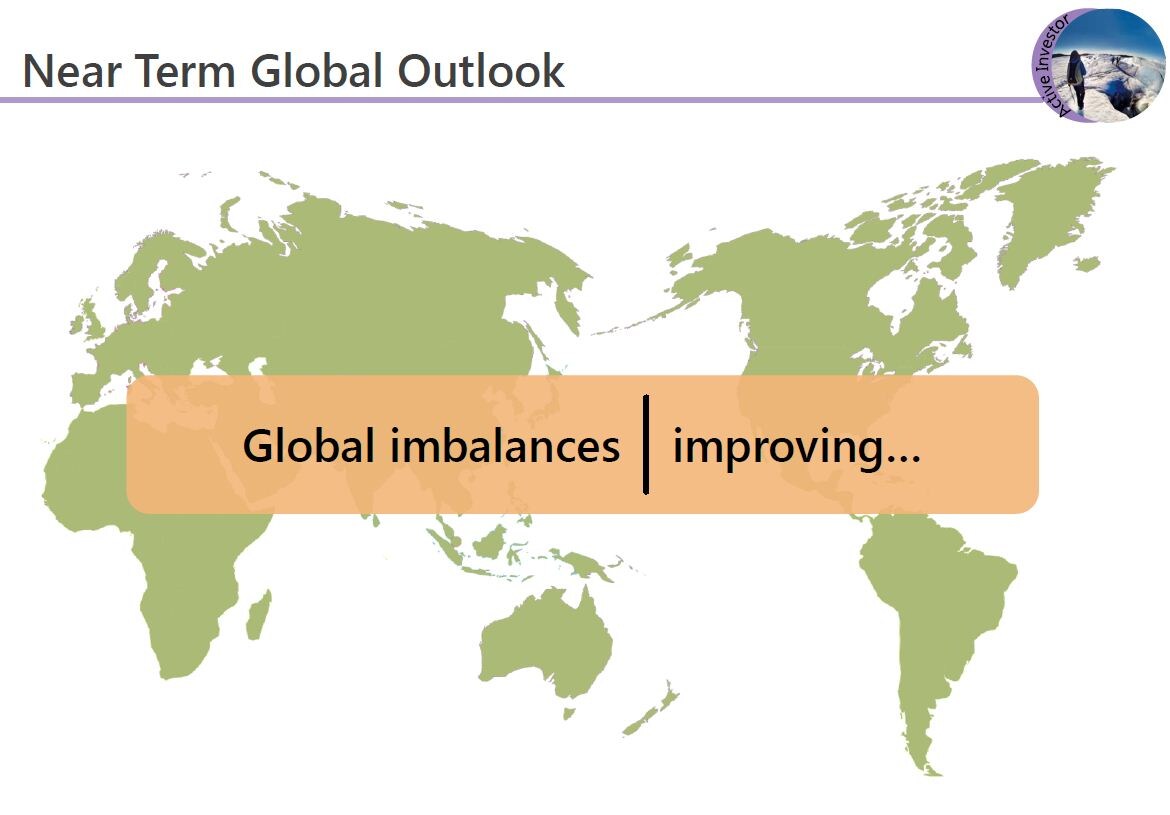
Lastly, structural imbalances around the world, although improving, they're not yet fully resolved. These include imbalances in global trade, in financial budgets and excessive government debts.
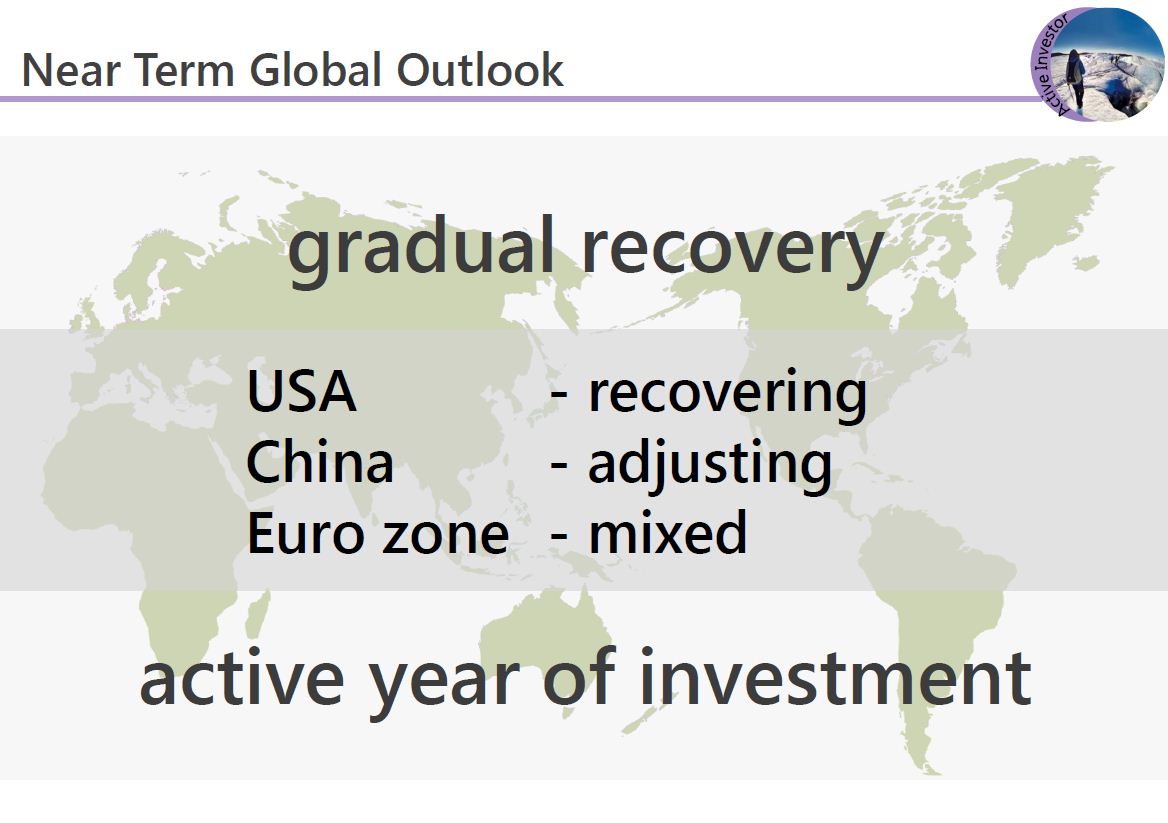
Taken together, we see a world that is gradually recovering. These were the conditions that led to one of the most active years in terms of investments for Temasek.
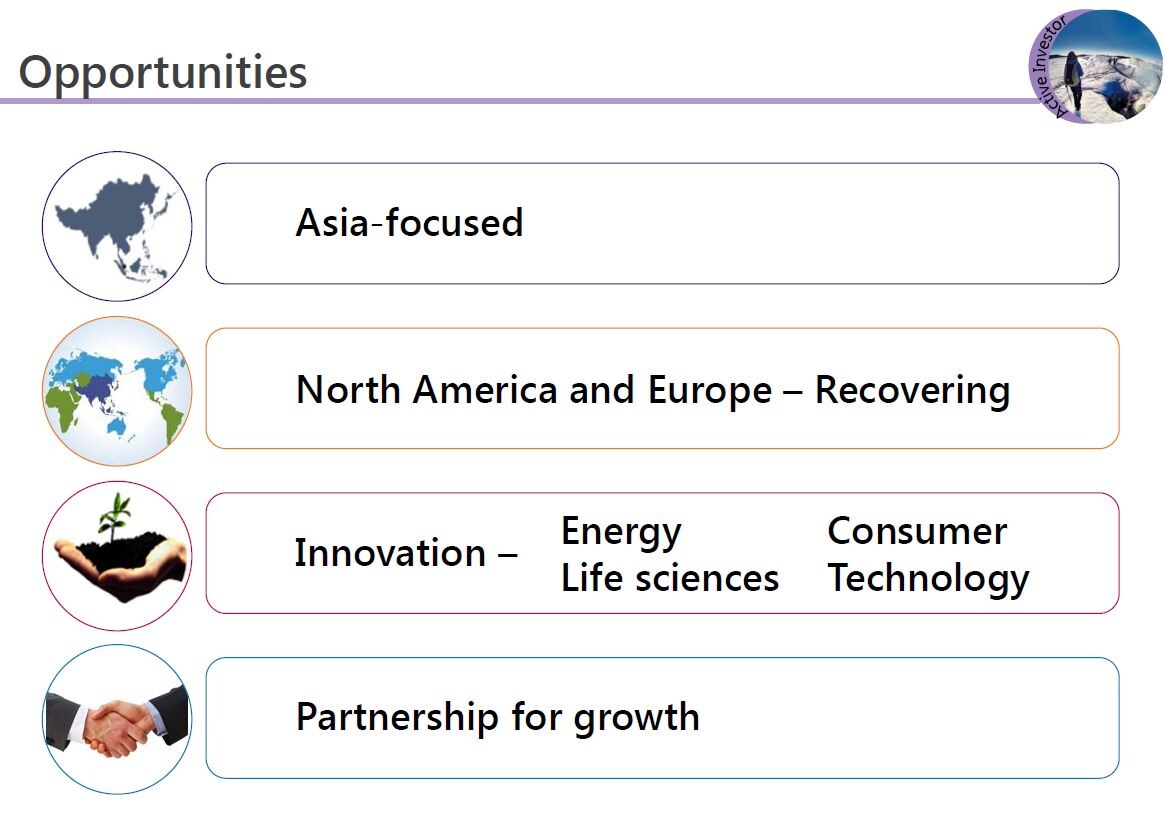
We believe our investment themes will guide us to find many opportunities in the years to come. Where then do we see the opportunities? We continue to anchor ourselves in Asia where we are well positioned to capture the long term growth benefits. North America and Europe are showing signs of improvement. Europe has good companies with solid fundamentals and these companies have global reach and global exposure. North America continues to be a centre stage for innovation and we continue to see companies with comparative advantage emerging.
Continuous innovation will lead to opportunities in energy, resources, life sciences and technology. All fit into our investment themes. We continue on the journey to build a sustainable platform to capture these opportunities. In addition to build our team and internal capabilities, we would also expand our network to work together with like-minded partners. This concludes my part of the presentation. I will now invite Siok Lan to share with you about our institution.
PEK SIOK LAN: Hi, good afternoon. My name is Pek Siok Lan. You have heard from Rohit and Yibing, an overview of our portfolio and our performance. This next segment is the exciting bit as I get to tell you a bit more about our institution and what makes us tick.
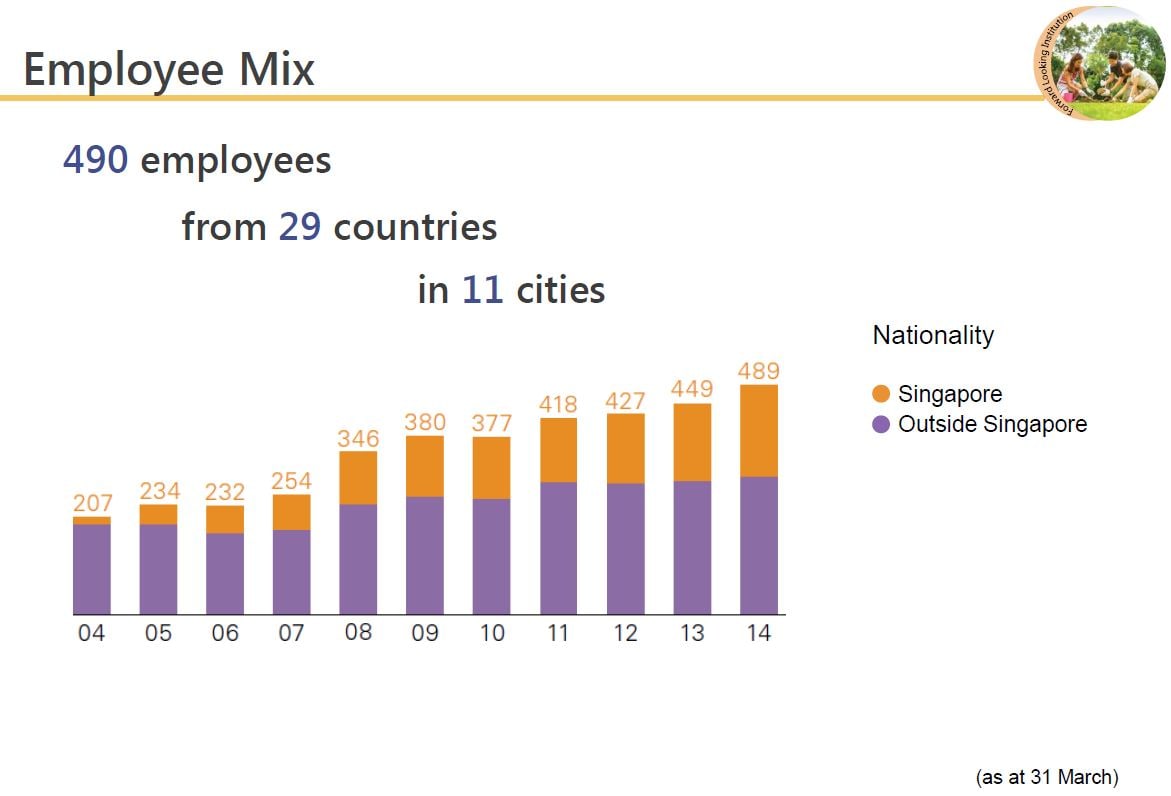
This year is our 40th anniversary. We have offices in 11 cities around the world and about 490 employees drawn from 29 countries. Despite the diverse culture and backgrounds, we are one team guided by our charter and by our MERITT values.
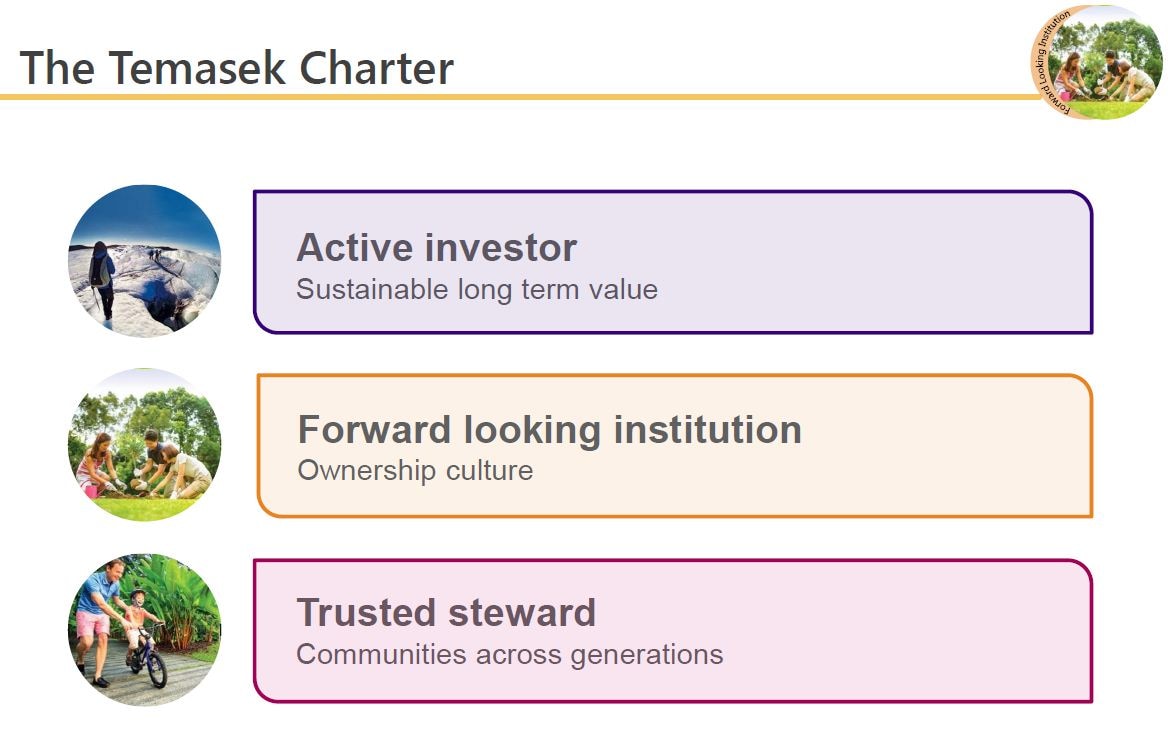
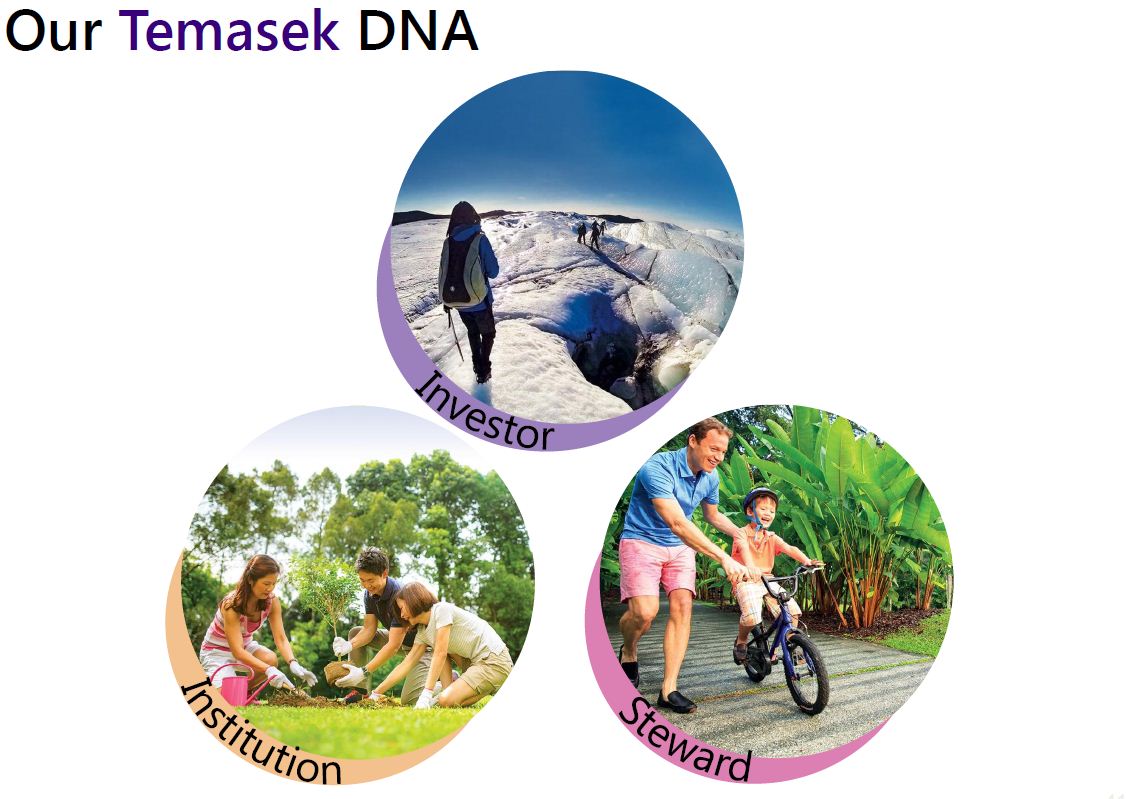
Our Temasek charter sets out three roles for us. We are first and foremost an active investor and shareholder, committed to delivering sustainable value over the long term. We are a forward-looking institution. What does that mean? These words embody several concepts, key of which is that we foster an ownership mindset, a mindset that puts the institution above the self, that emphasises the long term over short, and which aligns the interest of employees with that of the shareholder. We are a trusted steward, we contribute to the advancement of communities across generations and the promotion of good governance.
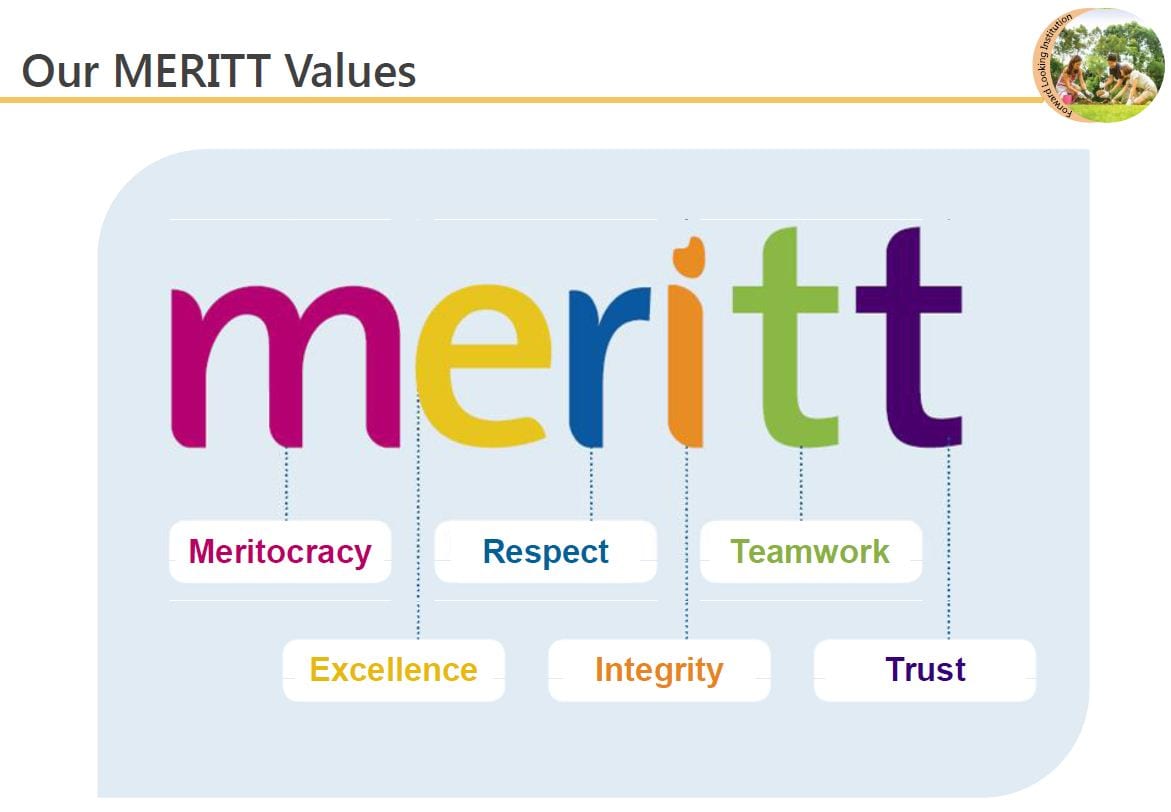
In addition to the charter, Temasek staff are also guided by our MERITT values – meritocracy, excellence, respect, integrity, teamwork and trust. Integrity, for example, is about being intellectually and professionally honest in all that we do. Excellence is an ideal that is demonstrated in our constant quest for improvement.
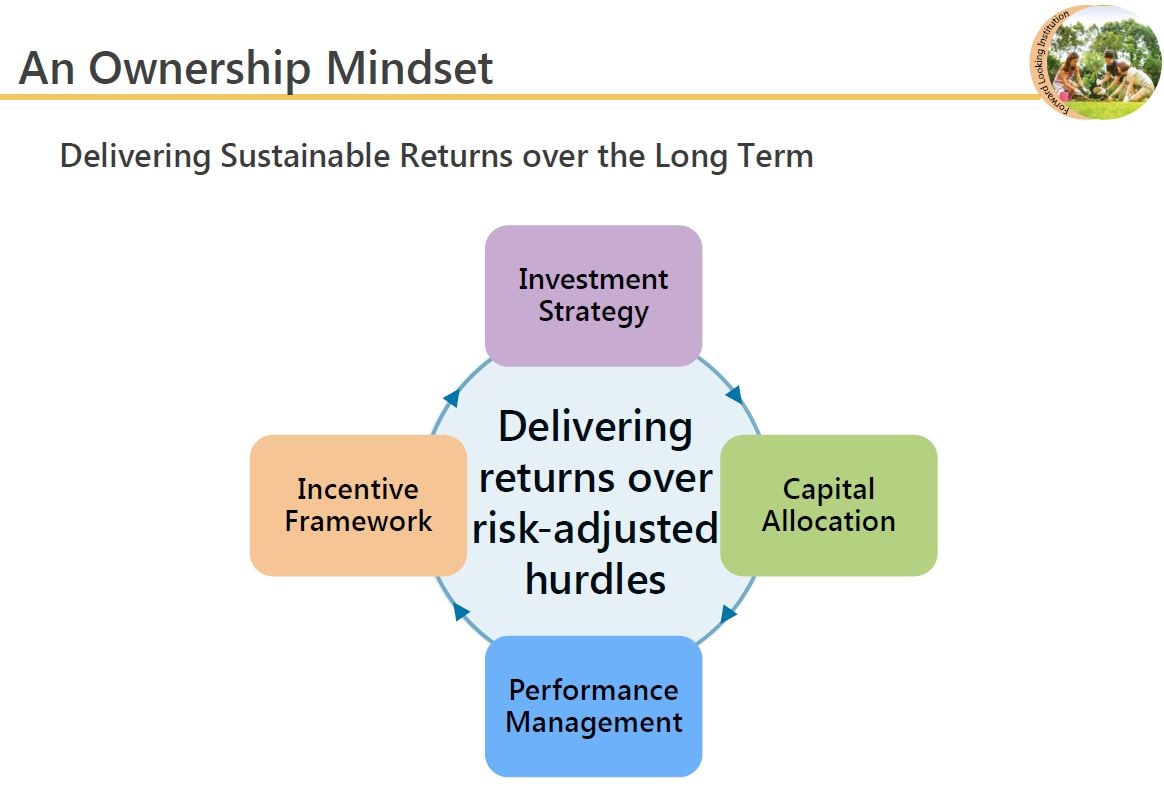
These values are best reflected in how we do business with an ownership mindset. We believe that an ownership mindset is important in order to deliver sustainable returns over the long term. We track and measure our returns against risk-adjusted hurdles. This drives our investment strategy, capital allocation and performance measurement.
Our compensation framework is also based on the same measurements so that there is an alignment between employee and shareholder interest. So in years when returns are positive we have a positive bonus pool to share and part of this bonus pool is deferred to future years. But conversely, when returns are negative, we all share a negative bonus pool, and that includes a clawback of the deferred bonuses earned in prior years during years of positive returns. And if need be, the clawback will also be from future bonus pools as well. So quite strict, but certainly is a good illustration of our ownership mind set.
Just as these values have been constant in the psyche of Temasek, in the same way we began life as a builder of companies and that still continues.
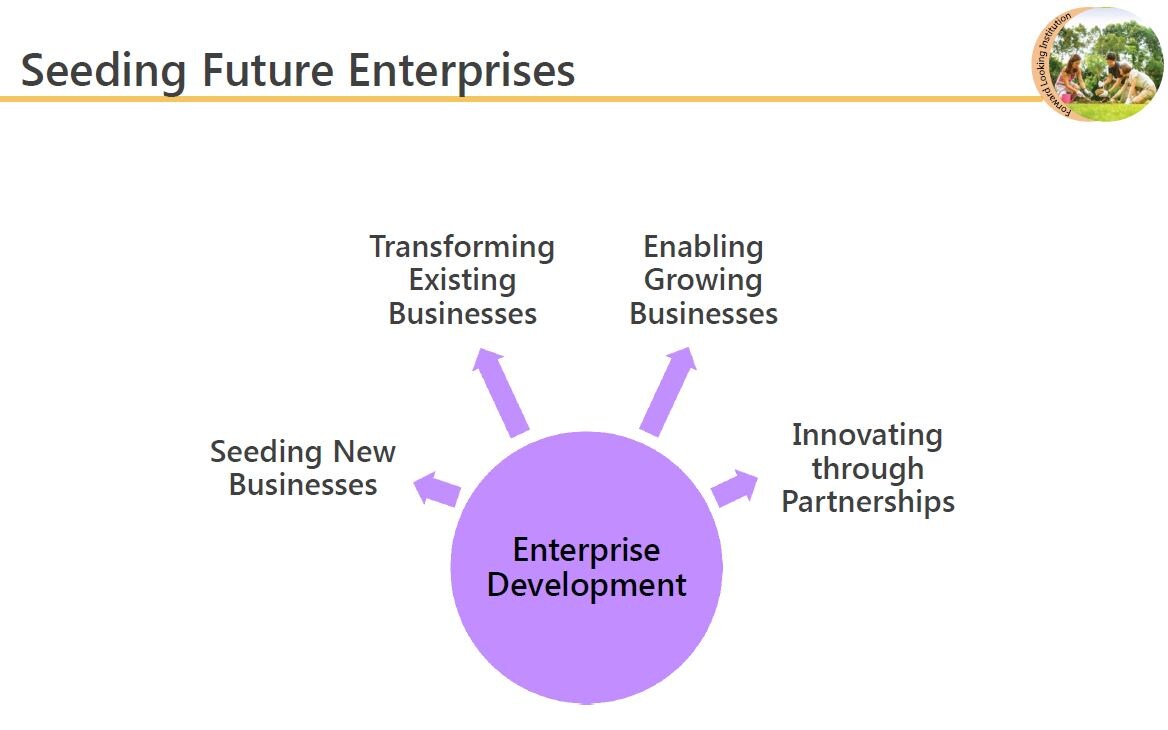
Last year we put focus on this effort by establishing the enterprise development group. The EDG group focuses on four aspects of building businesses – seeding new businesses, transforming existing businesses, enabling growing businesses and identifying innovative trends and opportunities.
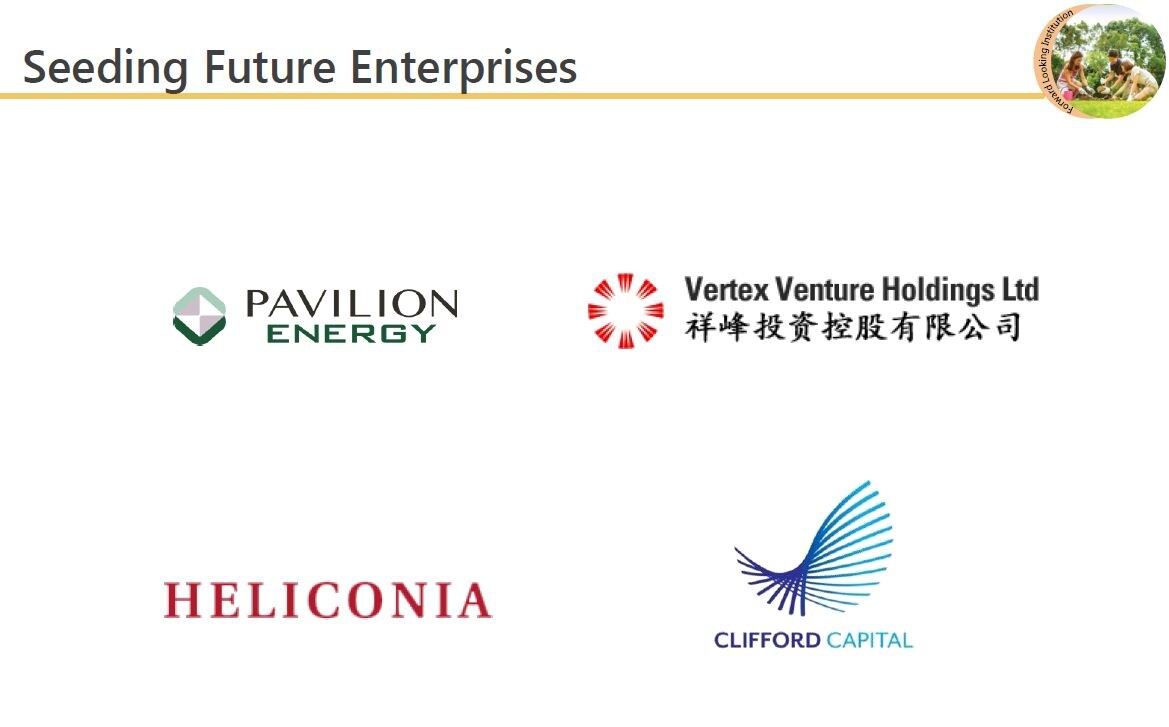
Examples are Pavilion Energy, which was established in 2013 to address the region's growing demand for cleaner energy, especially around the LNG supply chain. Vertex is one of the oldest venture capital firms in Asia. Last year it launched two new funds. One to invest in Singapore-based SMEs and the other for North American opportunities. Heliconia Capital was created to provide growth capital to Singapore-based SMEs. For example, it invested in FNA Group International, a travel retail player which invested in Cocoa Tree. I think we have chocolate bags for you to bring back, those are Cocoa Tree chocolate bags for you and your family. And it invested also in Razer, a gaming peripherals business which I think the gamers in this room would be very familiar with. Clifford Capital provides project financing for mid cap projects. It was part of a consortium which financed FPSO, you see on that screen, built by Singapore-based companies for Brazil.
So, just as our values are central to our existence and our role as a builder of companies has been there since the beginning, so too our role in our community is core to who we are. We recognise that we have a stake in the wellbeing of our community and a responsibility to exercise good stewardship through our social contributions. We engage our communities on the principles of sustainability and good governance.
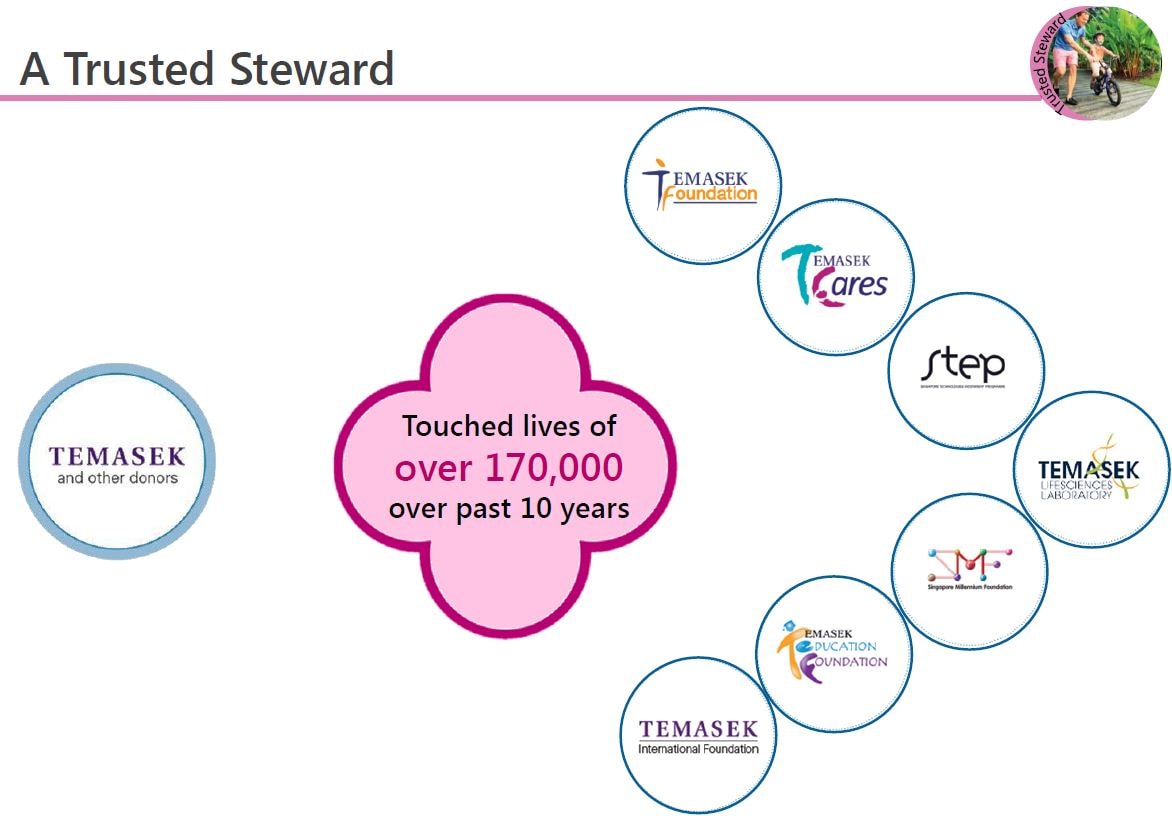
Since our inception in 1974 we have established 16 endowments in Singapore and Asia, aimed at building people, communities, capabilities and rebuilding lives. For example, in building people our approach is to train the trainers in the field of education, healthcare and other areas and they in turn would train others and these activities have had an impact.
Over the last 10 years programs that we have supported have touched the lives of 170,000 people.
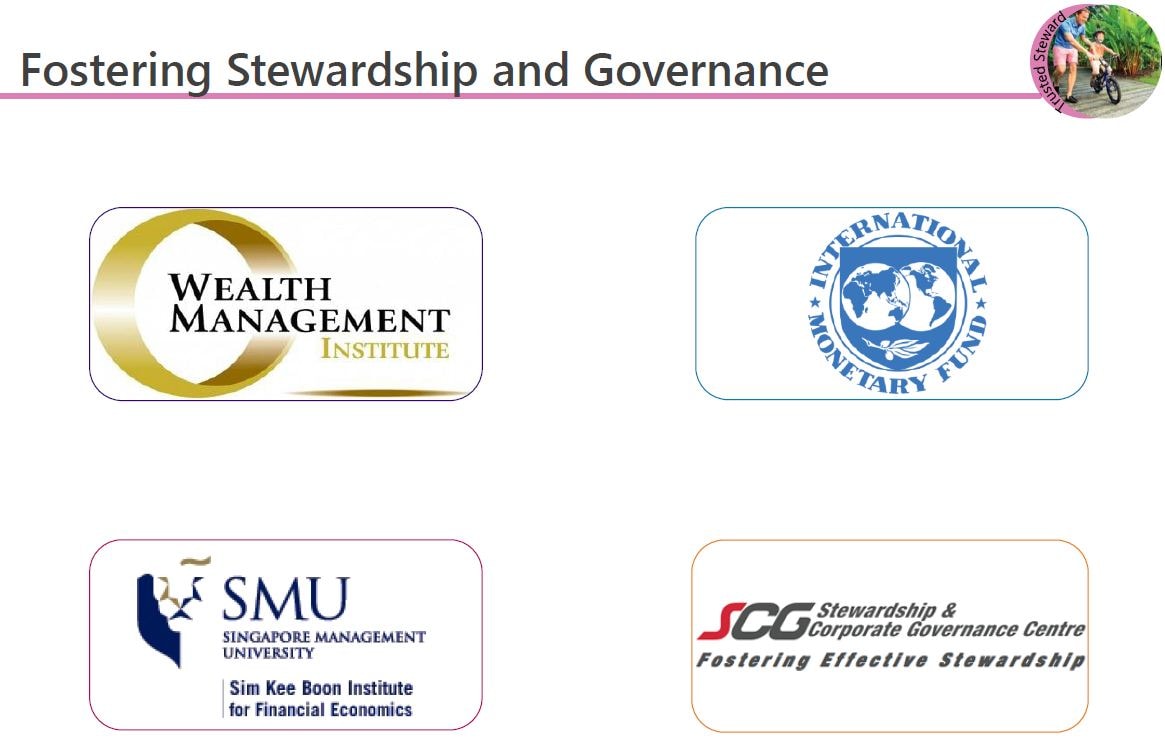
In addition to community programs we also engage stakeholders in the development of sound governance practices. Examples are the Wealth Management Institute. In 2003, we established WMI to develop talent for Singapore and Asia. Its flagship Master of Science in Wealth Management program was ranked second in the world by the 'Financial Times'. So thank you to the FT.
The International Monetary Fund Santiago Principles. In 2008 we worked actively with the IMF and other investors to develop the Santiago Principles for sovereign investments.
The Sim Kee Boon Institute for Financial Economics. We donated S$10 million in 2008 to the Singapore Management University to establish this Institute for Education and Research in the area of finance and economics.
And finally, the Stewardship and Corporate Governance Centre. In 2011 we launched the centre to advocate responsible stewardship and good governance.
In summary, these are core parts of our DNA – to live by our values, to build businesses, and to support the communities in which we live.
You see on the slide the activities of our colleagues at Temasek. I think the top slide is Claire having a trek in Iceland. On the right you have Johan, our marathoner, with his child, in what, I think, looks like Botanic Gardens. And in the third picture there's Florence, Justin and Claris planting what I'm told is a jasmine tree!
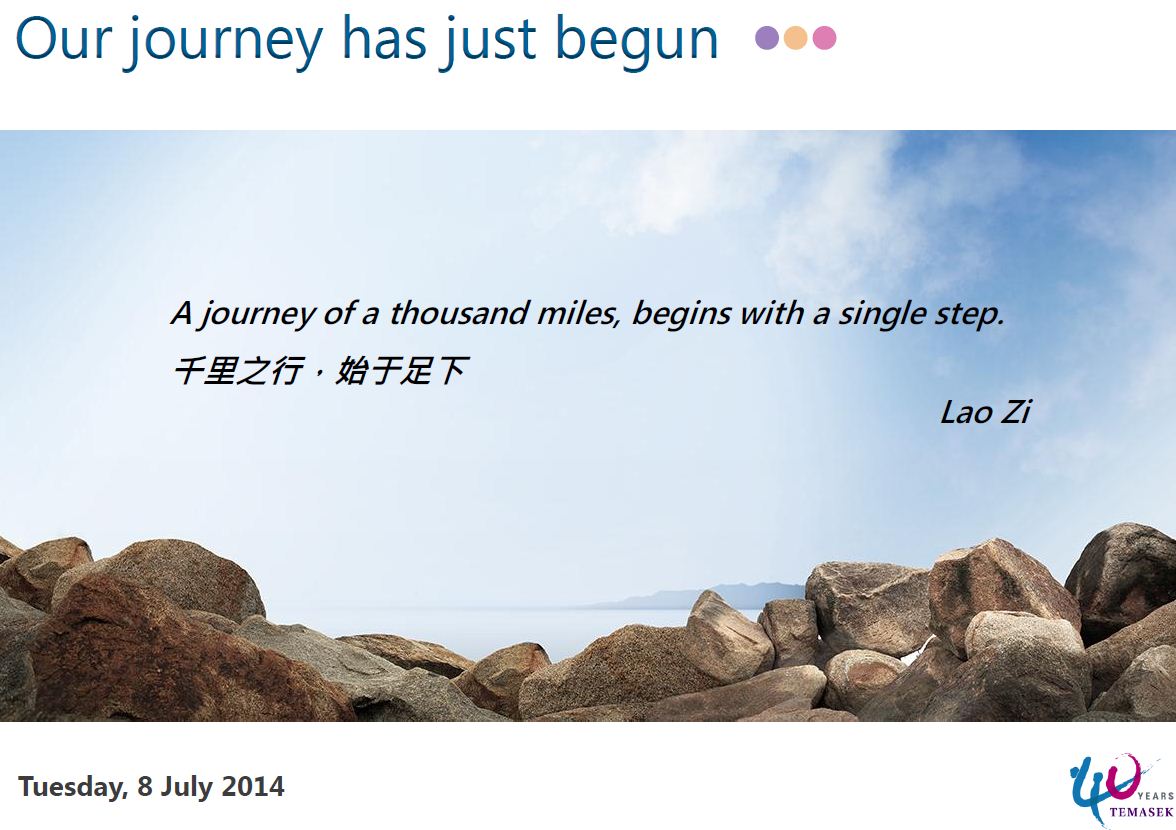
As we turn 40, it is time to reflect on where we are and to set our sights on the journey ahead. And I leave you just with this quote from Lao Zi – “A journey of a thousand miles begins with a single step”.
Thank you.
* * * * * * * *
For an edited transcript of the Q&A session, please CLICK HERE