We aim to construct a resilient and forward-looking portfolio to deliver good sustainable returns over the long term.
Since our incorporation in 1974, we have evolved from a holding company of Singapore-based assets into a global investment company. In the 2000s, we stepped out and grew with an emerging Asia, setting up offices in India and China. In the 2010s, we embarked on our strategy to be a global investor and expanded into developed markets such as the US and Europe.
In 2019, we set out our T2030 strategy to focus on constructing a resilient and forward-looking portfolio that can withstand exogenous shocks and perform through market cycles to deliver good sustainable returns above our risk-adjusted cost of capital over the long term.
Portfolio Composition
Our portfolio is well diversified across geographies and sectors, and comprises three segments:
- Singapore-based Temasek Portfolio Companies (TPCs)
- Global Direct Investments (GDIs)
- Partnerships, Funds, and Asset Management Companies (PFAs)
Unless otherwise stated, all financial information is presented in Singapore dollars. Portfolio figures from the financial year ended 31 March 2016 onwards have been restated to value our unlisted investments on a mark-to-market basis. Our prior reporting basis valued our unlisted investments at book value. The valuation basis is unchanged for listed investments that are valued at market prices, and unlisted funds and co-investments that are already marked to market.
Our current portfolio distribution across these segments is a reflection of the investment strategies which we have adopted over the years.
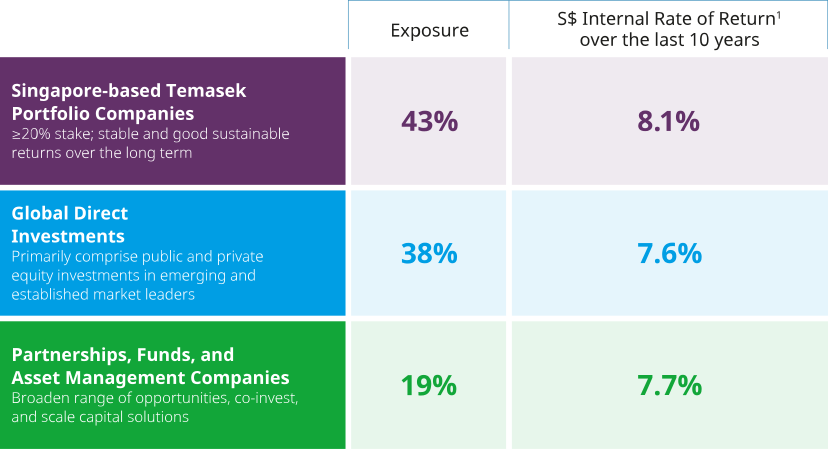
Portfolio Returns by Portfolio Segments (%)
(as at 31 March 2026)
1 Internal Rate of Return is the money-weighted returns of our invested portfolio and takes into account the timing and size of investment cash flows.
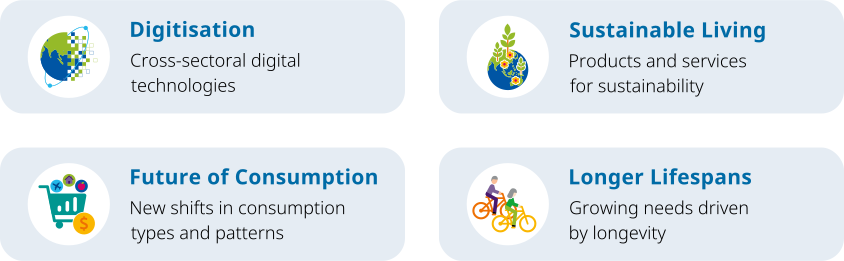
We drive value creation and strong performance across our TPCs through a mix of cross-portfolio initiatives and asset-specific strategic levers:
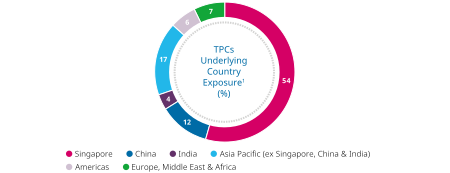
Singapore-based Temasek Portfolio Companies (TPCs) by Underlying Country Exposure1 (%)
(as at 31 March 2026)
1 Distribution based on underlying assets.
We have the flexibility to invest across a broad opportunity set spanning:
The key success drivers that enable our GDIs to deliver good sustainable returns over the long term are:
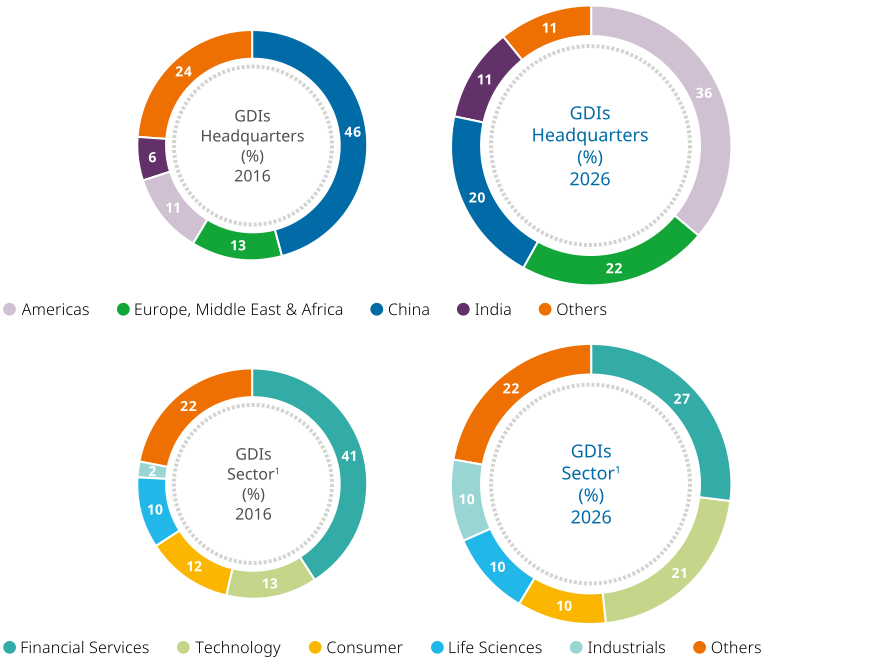
Global Direct Investments (GDIs) by Headquarters & Sector1 (%)
(as at 31 March)
1 Distribution based on underlying assets.
Our Partnerships and Funds
We are invested in a high-quality portfolio of funds diversified across geographies, sectors, and vintages. Performance is driven by the managers’ differentiated sourcing capabilities, deep value creation expertise, and strong local and sectoral relationships.
- These managers provide access to proprietary deal flow, leverage operational and strategic capabilities to drive portfolio company performance, and benefit from deep relationship networks and long-standing market and industry connections. In addition, they generate valuable sector and market insights and create opportunities for co-investments alongside high-quality assets.
The key success drivers for our partnerships and fund investments are:
Asset Management Companies (AMCs)
Our AMCs continue to be a key pillar of our PFA strategy, with distinctive capabilities across public and private markets to deliver differentiated solutions for investors globally.
- Our main Asset Management Platform is Seviora Holdings, which comprises Azalea Investment Management, Fullerton Fund Management, InnoVen Capital, SeaTown Holdings International, and Seviora Capital. With a breadth of offerings across public and private market strategies, they deliver multi-asset, multi-strategy exposure tailored to evolving investor needs across risk profiles and geographies, particularly in Asia and adjacent markets.
- Together with Temasek Partnership Solutions, Seviora is undertaking a strategic review of existing AMCs and exploring growing new ones. The strategic review is focused on optimising our AMC portfolio mix, sharpening investment focus areas, and aligning resources with high-growth opportunities in Asian public and private markets. Together, we aim to build a leading Asia-based, multi-strategy asset management platform that combines local insight with global execution capabilities, delivering value for investors over the long term.
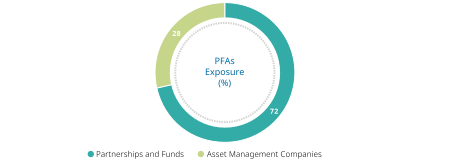
Partnerships, Funds, and Asset Management Companies (PFAs, %)
(as at 31 March 2026)
Investment Framework
Our investment discipline is centred around intrinsic value and our risk-return framework. This framework forms the basis of our investment decisions, capital allocation, performance measurement, and incentive system.
When we invest in companies, we conduct bottom-up intrinsic fundamental valuation analysis and due diligence to determine a company’s fair value. We also stress test our assumptions to help us gauge the range of outcomes in potential future returns under different assumptions.
We compare our estimate of fair value with current market valuation to determine if an investment makes sense at the proposed price.
Risk-Adjusted Cost of Capital (RACOC)
Each investment is assigned a RACOC that takes into account the investment’s risk characteristics such as industry risk and capital structure. Investments with higher risk will have higher costs of capital. For these investments, we require higher expected returns, which in general, will be at a positive spread over the RACOC.
We assess our performance by measuring our Total Shareholder Return against our overall RACOC, which is the weighted average RACOC across all our individual investments.
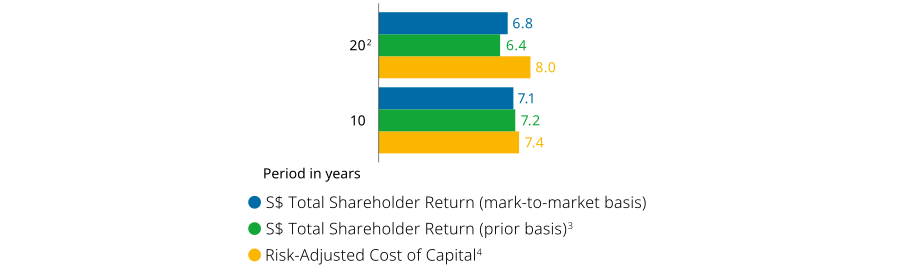
S$ Total Shareholder Return1 Relative to Risk-Adjusted Cost of Capital (%)
(as at 31 March 2026)
1 Total Shareholder Return (TSR) has been restated to reflect the move to mark-to-market (MTM) reporting, except for periods prior to 31 March 2016.
2 Due to historical data constraints, MTM valuation prior to 31 March 2016 is not available. Hence, the 20-year MTM TSR includes a one-time NPV uplift in March 2016 due to the transition in valuation of unlisted investments from a book value basis to an MTM basis.
3 Unlisted investments valued at book value, which refers to Temasek’s cost of investment plus our share of the investee company’s profits or losses, changes in other equity reserves, minus write-downs (if any).
4 We periodically review our cost of capital framework. In April 2025, we streamlined our cost of capital methodology: the revised approach is based on the risk-free rate, equity risk premium, industry risk, and capital structure. This streamlining supports a greater focus on expected returns.
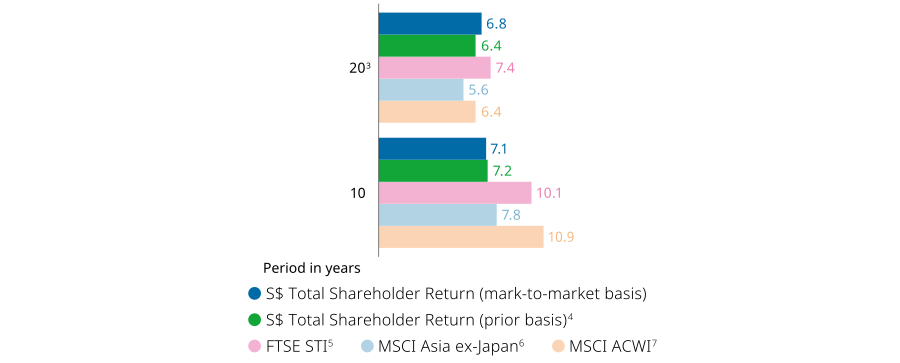
Total Shareholder Returns Relative to Market Indices
Our portfolio is differentiated in its composition, reflecting our long-term investment approach in Singapore. About 52% of our portfolio comprises Singapore-headquartered companies and 27% of our portfolio’s underlying exposure is to Singapore.
This includes listed and unlisted companies held for long-term value creation, several of which operate critical infrastructure or provide key services. Given this profile, our portfolio is not directly comparable to market indices such as the Straits Times Index.
In addition, our portfolio outside of Singapore spans diverse geographies and sectors as a result of our bottom-up investing approach. This composition differs from global market indices which are significantly concentrated in US equities.
S$ Total Shareholder Return1 Relative to Market Indices2 (%)
(as at 31 March 2026)
1 Total Shareholder Return (TSR) has been restated to reflect the move to mark-to-market (MTM) reporting, except for periods prior to 31 March 2016.
2 Temasek’s mandate is to deliver good sustainable returns over the long term. These market indices are broad indices, including a wide range of stocks across different countries and industry sectors. The allocations of the indices across sectors and countries are typically based on the market capitalisation of listed stocks, and it is more commonly used for passive investing through Exchange-Traded Funds (commonly known as ETFs). Temasek’s portfolio composition is very different from these indices, especially as Temasek’s portfolio includes a proportion of unlisted assets. Market indices provide broad reference points as to how the overall market had moved over time. Temasek has set out our performance against various indices just for information, where there is a complete dataset available.
3 Due to historical data constraints, MTM valuation prior to 31 March 2016 is not available. Hence, the 20-year MTM TSR includes a one-time NPV uplift in March 2016 due to the transition in valuation of unlisted investments from a book value basis to an MTM basis.
4 Unlisted investments valued at book value, which refers to Temasek’s cost of investment plus our share of the investee company’s profits or losses, changes in other equity reserves, minus write-downs (if any).
5 The FTSE STI Index measures the performance of the top 30 companies listed on the Singapore Exchange, net of applicable dividend withholding taxes.
6 The MSCI AC Asia ex-Japan Index measures the performance of large to mid-sized companies in Asia, excluding Japan, net of applicable dividend withholding taxes.
7 The MSCI ACWI Index measures the performance of large to mid-sized companies in the developed and emerging markets, net of applicable dividend withholding taxes.
Internal Carbon Price
We also apply an internal carbon price of US$65 per tonne of carbon dioxide equivalent (tCO2e) to each investment to better assess the potential climate transition impact, thereby enabling a greater focus on the long-term climate resilience of our portfolio. We expect to progressively increase this to US$100 per tCO2e by 2030.
Integrating ESG Across Our Investments
We embed an Environmental, Social, and Governance (ESG) framework across the entire investment lifecycle to manage material risks, support our portfolio companies’ ESG progress, and reinforce the resilience of our portfolio.
This includes pre-investment due diligence to ensure alignment with our governance and sustainability standards. Post-investment, where we have an opportunity, we engage with our portfolio companies to advance sustainability practices, including strengthening climate targets and transition plans, supporting workforce transformation, promoting safe and inclusive workplaces, and fostering good governance.
Our ESG integration priorities are tailored to the mandates of our three portfolio segments, with a focus on materiality and driving sustainability outcomes.
Early-Stage Investments
We invest in early-stage companies to keep abreast of the latest technologies and innovations, drive portfolio development efforts, and identify potential winners early.
We are cognisant of the risks and challenges these early-stage companies face and accept the binary risks that come with investing in them. However, some of these companies also have the potential to achieve significant growth over time and deliver outsized returns.
We manage our early-stage risk through appropriate sizing and diversification. We typically invest smaller amounts at the time of initial investment, with a view to increasing our stake if the company demonstrates successful business execution. In addition, we cap our exposure to this segment at 6% of our overall portfolio value as part of our risk management framework.
As at 31 March 2026, our early-stage investments account for about 4% of our total portfolio value, with about half through direct investments and the rest through venture capital funds.
This is driven primarily by our Emerging Technologies and Innovation teams. In addition, our early-stage exposure includes our venture capital platform (Vertex Holdings) and two venture debt platforms (EvolutionX Debt Capital and InnoVen Capital) that we seeded and built.
Investment Engagement and Stewardship
Amidst uncertainties in the macro environment, companies must stay agile and laser-focused on sharpening and executing their strategies to navigate a challenging world of disruption, geopolitical risk, and shifting shareholder and stakeholder expectations.
As an investor and owner seeking to achieve good sustainable returns over the long term, Temasek is committed to working constructively with our portfolio companies, their boards, and leadership, to ensure a close alignment between strategy and performance, as well as returns and rewards. Where appropriate, we seek to add value by partnering with our investee companies on innovation, growth, and transformation initiatives that strengthen long-term competitiveness.
As an engaged shareholder, we integrate stewardship into our investment approach, and proactively promote good governance, ethical business practices, and compliance with laws. Engagement and voting are key levers through which we exercise our shareholder rights to influence governance quality, reinforce accountability, and support long-term value creation.
To strengthen the consistency and effectiveness of this approach, our Investment Stewardship team provides focused expertise in engagement, voting, and governance matters, and works closely with our investment teams to ensure stewardship considerations are systematically embedded across ongoing ownership and portfolio oversight.
Capital Allocation
At the portfolio level, we set a three-year rolling capital allocation and divestment plan that is reviewed by senior management and approved by our Board annually. This plan guides our investment and divestment activities, and liquidity, to maintain a strong balance sheet.
We have full discretion as an owner and investor to reshape and rebalance our investment holdings as the situation warrants. From time to time, we may invest in or divest from selected positions based on our outlook and risk-return appetite. We may take concentrated positions, remain in cash, and/or use derivatives to hedge currency or protect against potential losses of our underlying investments.
Our investments are predominantly in equities. We adopt a long-term view of our investments and are not focused on short-term volatility. We manage our liquidity and balance sheet for resilience and investment flexibility.