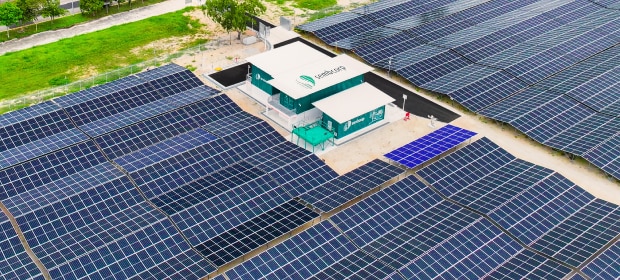
Physical Impacts
Damages from extreme weather events and chronic impacts from changing climate.
As a generational investor, we closely monitor climate-related risks and opportunities across different time horizons by incorporating climate scenario analysis in our investment process and expected returns simulations. Our financial discipline in maintaining a strong balance sheet gives us the investment flexibility to reshape and rebalance our investment holdings as we build a resilient portfolio and deliver good sustainable returns over the long term.
Scenario analysis is a key tool for generational investors like Temasek to assess and manage climate-related risks and opportunities under various policy, social, and technological pathways, and their associated temperature outcomes. By employing scenario analysis, we are able to evaluate the implications of different climate scenarios on our portfolio to support more informed investment decisions.
From a top-down perspective, climate scenario analysis is applied as an overlay on our macroeconomic forecasts alongside geopolitical events in our Temasek Geometric Expected Return Model (T-GEM), which uses a scenario-based approach to simulate our 20-year long-term expected returns.
From a bottom-up perspective, we apply our climate value impact tool, utilising a scenario-based approach to estimate potential climate-related impacts. In addition, our internal carbon price takes into consideration carbon price assumptions across various climate scenarios.
Combining both top-down and bottom-up approaches — with both anchored by a consistent set of scenarios — in our climate risk assessment allows us to achieve a deeper understanding of the climate risks and opportunities that our portfolio may be exposed to.
We use three climate scenarios to assess the potential climate-related physical and transition risks and their impacts on our portfolio.
We regularly refresh climate scenarios in response to ongoing policy developments and the latest understanding of potential impacts of physical climate risks. In our latest refresh, the NGFS Fragmented World scenario (2.4°C) now serves as our baseline scenario. It replaces the Inevitable Policy Response Forecast Policy Scenario (IPR FPS).
Our shift to the NGFS Fragmented World scenario reflects an outlook driven by uneven policy ambition and weaker global policy coordination than previously anticipated. Some jurisdictions are advancing their decarbonisation goals through carbon pricing, deployment of renewable energy, and the setting of sector standards. Others, however, have moderated their approach in response to domestic political pressures, energy security imperatives, and affordability constraints.
The result is a patchwork of divergent policies and associated timelines: carbon prices and regulatory stringency vary across markets, cross-border measures and trade frictions become more pronounced, and technology diffusion is slower where international cooperation is weak. Emissions abatement is increasingly backloaded, raising the risk of missing near-term emissions reduction targets. When policies are eventually tightened in response to escalating physical risks, transition impacts may be more abrupt and disruptive.
In summary, the higher implied temperature of 2.4°C by 2100 that now serves as our baseline reflects the delay and divergence in global climate policies, resulting in elevated physical and transition risks. In the NGFS Fragmented World scenario, acceleration in policy changes is delayed until 2030. 80% of countries reach net zero targets while others broadly continue to operate on prevailing policies. Considerable dispersion in carbon prices across regions exists, with low to moderate deployment of carbon removal technologies.
Our adoption of the NGFS Fragmented World as the Medium Ambition (baseline) scenario has two key implications for climate risk assessment.
First, the higher warming outcome is expected to bring about an increase in the severity and frequency of physical risks over time, intensifying both chronic and acute risks. This strengthens the case for adaptation and asset-level resilience planning.
Second, the transition becomes more disorderly where delayed action is followed by uncoordinated climate policy tightening. This creates greater adjustment pressures and more uneven impact across sectors and geographies.
Given the considerable uncertainty surrounding forecasts and climate sensitivity, we also model two alternative scenarios to simulate a wider range of plausible outcomes. The first alternative scenario, the High Ambition scenario, models a pathway aligned with the Paris Agreement goal of limiting global temperature rise to 1.5°C. The second alternative scenario sits at the other end of the spectrum: our Low Ambition scenario simulates an outcome where climate policy traction is so weak that global temperature rise exceeds 4.0°C.
Our top-down climate scenario analysis assesses how climate-related risks and transition pathways can affect economic activity across sectors and regions.
It combines scenario-based climate shocks with sector- and region-specific characteristics to estimate the potential impact on prices, output, and gross value added. These shocks include transition effects, such as carbon costs and changes in demand, as well as physical climate risks arising from both acute events and chronic changes.
To reflect differences in exposure, the analysis considers factors such as emissions intensity, capital intensity, production inputs and supply chain linkages, together with assumptions on cost pass-through and demand sensitivity. The analysis also factors in the impact of acute physical hazards, including flooding, tropical cyclones, windstorms, and wildfires, alongside chronic impacts on labour and land productivity over time.
Using an input-output framework, the analysis traces how climate shocks may flow through supply chains and influence broader macroeconomic outcomes, including gross domestic product (GDP), inflation, and interest rates. For example, higher carbon costs in one sector may raise costs for downstream industries and, in turn, the wider economy. The modelling also takes into account the recycling of carbon tax revenues through government spending, while the inclusion of resulting interest rate impacts enhances the realism of the overall approach. Country- and regional-level GDP and inflation impacts are then derived by aggregating sector-level results, with interest rates estimated using a standard policy rule that reflects the balance between climate-driven inflation and changes in economic output.
We recognise the trade-off between transition risks in the shorter term and physical risks in the longer term. While greater policy action may increase transition risks in the shorter term, this will reduce the magnitude of physical risks in the longer term. As a result, we adopt differing time horizons for the two categories of risk. For physical risks, we consider up to 2050 as short term and 2050–2100 as long term. For transition risks, we consider a five-year time horizon as short term, a 10-year time horizon as medium term, and a 20-year time horizon as long term. However, as implied by the differing time frames adopted for physical and transition risks, we generally expect the effects of climate-related transition risks to occur across a shorter time horizon — over the next 20 years, and the effects of climate-related physical risks to occur across a comparatively longer time horizon — up until 2100.
Using the risk inputs we assess as part of our scenario analysis, we mapped out the climate risk impact channels in further detail.

Policy measures and price and non-price mechanisms, such as carbon taxes and/or phaseouts, result in both macro impacts such as growth and inflation and company-level impacts via a shift in the competitive landscape.

Technological innovation to support the transition to a lower-carbon economy could cause a shift in the competitive landscape such that new sectors emerge while certain existing ones become unviable.

As global temperatures rise, exposure to extreme heat could become more frequent, severe, and occur over longer periods of time.

Unpredictable weather patterns could cause more locations to be susceptible to increased frequency and intensity of heavy rainfall.

Sea level rise could cause increased vulnerability to coastal flooding.

Extreme weather events such as wildfires, flooding, famines, and water insecurity could increase in frequency and intensity.
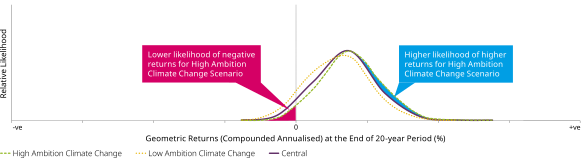
Our Central Scenario incorporates the Medium Ambition Climate Change Scenario and projects higher 20-year expected returns for the Temasek portfolio when compared to the Low Ambition Climate Change Scenario, but lower 20-year expected returns compared to the High Ambition Climate Change Scenario, where there is concerted effort and strong actions to mitigate climate change and carbon emissions for a more liveable world. These results reaffirm our belief in the importance of looking beyond portfolio decarbonisation and working to drive real economy carbon reduction through collaboration on climate action with our portfolio companies and our wider ecosystem.
It is important to recognise that while T-GEM simulates a range of possible returns for our portfolio over a 20-year period, these should not be viewed as predictions of actual outcomes. Rather, the climate assumptions incorporated into T-GEM assist us in understanding the potential implications of different climate scenarios and the importance of building a resilient portfolio. There are several significant areas of uncertainty that we consider in assessing the overall resilience of our strategy for the climate-related risks identified and the potential impact on expected returns. The areas of uncertainty include the complex nature of climate scenario analysis, which requires various assumptions to be made on the inputs used, as well as the need for continuous updates as data becomes more robust.
In addition, the long time horizon in scenario analysis increases uncertainty regarding the assumptions applied. Our assessment also depends on assumptions regarding the response of companies to conditions of the climate scenarios under consideration. Taken together, these significant uncertainties increase the degree of judgement required to assess our climate resilience.
As part of our ongoing risk monitoring initiatives under our Organisational Risk Management Framework, the climate resilience of our portfolio is assessed on an annual basis using a bottom-up approach, where the overall value impact contribution from individual portfolio companies is considered.
The climate value impact assessment focuses on direct investments from our listed portfolio and our 20 largest unlisted assets by value (hereafter referred to as “Temasek’s aggregated portfolio”), which represent over 75% of our direct investments. The bottom-up assessment estimates the expected valuation impact of our baseline NGFS Fragmented World scenario on Temasek’s aggregated portfolio. The impact is broken down into key transmission channels, reflecting how climate-related physical, policy, and technological changes affect the financial performance of companies.
Modelling Framework
The modelling framework factors in the associated economic, energy system, and climate variables and analyses how resulting macroeconomic and policy shocks would impact the annual earnings of our assets. A time horizon of up to 2050 is used in projecting changes in asset value. In addition, the model incorporates company-specific inputs, including geographic footprint, revenue segmentation, and emissions intensity while simulating the selected company’s response to a fragmented transition scenario. It accounts for shifts in market share, cost pass-through to customers, and the pursuit of economically rational abatement opportunities under conditions of higher and less predictable transition costs.
The output from the model includes changes in the current value of the selected company, disaggregated across key impact channels. These impact channels include policy costs, demand shifts, competitiveness effects, and residual physical risk exposure. This enables risk and opportunity assessment across portfolios, sectors, regions, and companies, with emphasis on exposures that are amplified by uneven transition pathways.
Physical and Transition Risk: Seven Impact Channels
Damages from extreme weather events and chronic impacts from changing climate.
Actions that reduce the negative effects of physical impacts on financial assets.
Impact from reduced demand for emission-intensive products.
Increasing demand for low-carbon products and materials, with positive impact for companies involved.
Increase in costs due to carbon price applied to the company’s emissions.
Steps taken to reduce emissions in response to rising carbon costs.
Positive impact from the ability to pass through costs and variable impact from changes in market share (depending on the company’s emissions intensity compared to its competitors).
Results and Insights from Our Scenario Analysis
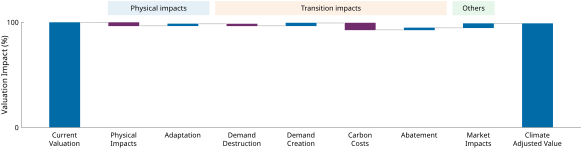
The modelling results indicate that the expected overall valuation impact of climate change on Temasek’s aggregated portfolio is slightly negative under the NGFS Fragmented World scenario, with physical and transition-driven economic shocks taken into consideration up to 2050. (For an indicative assessment of climate-adjusted valuation impact for Temasek’s aggregated portfolio under NGFS Fragmented World scenario, see the chart below.)
In the NGFS Fragmented World scenario, fragmentation softens demand for clean technologies and limits the competitive upside for low-carbon companies. While direct carbon costs are lower in certain jurisdictions under the Fragmented World scenario relative to more coordinated pathways, this is partially offset by policy inefficiencies and broader market impacts.
It is important to note that limitations remain in climate scenario modelling, including potential gaps in the quality, availability, and scope of climate data for particular regions and sectors.
Proxies may be employed to address such gaps, which limits the precision of analysis. Accurately modelling the impact from low-carbon technologies is a further challenge, given inherent technological uncertainty. Additionally, the results from climate scenario analysis are sensitive to the baseline scenario employed.
Valuation Impact by Physical and Transition Impact Channels
In 2021, Temasek first set an ICP of US$42 per tonne of carbon dioxide equivalent (tCO2e) to embed the cost of carbon in our investment and operating decisions, and to further align to our net zero ambition. This was subsequently increased to US$50 per tCO2e in 2022 and to US$65 per tCO2e in 2024, with a view for the carbon price to reach US$100 per tCO2e by 2030.
We carry out a review of the ICP every two years to take into account carbon price projections by international bodies.
Our ICP serves several purposes. It informs our transition risk analysis, thereby strengthening portfolio resilience and helping us build a forward-looking portfolio aligned with the global ambition for net zero.
Additionally, our ICP is incorporated into a range of internal management tools in an effort to align our institutional practices and to encourage climate-aligned decision making and behaviour among our employees.
| Objectives | Related use cases |
|---|---|
Portfolio Resilience To appropriately identify and account for transition risk in investment decisions, thereby ensuring acceptable exposure at asset and portfolio level |
|
Portfolio Alignment To progressively align our portfolio to help meet our net zero portfolio emissions ambition by 2050 |
|
Institutional/Ecosystem Alignment To encourage behaviours and outcomes across the organisation that promote emissions reduction |
|
We conducted a heatmap assessment to understand the potential exposure of our investments to sectors with financially material impacts and dependencies on nature. This sector-level analysis enables us to understand our exposure to natural capital risks by identifying the highest exposure to key drivers of biodiversity loss and the highest level of dependence on ecosystem services.
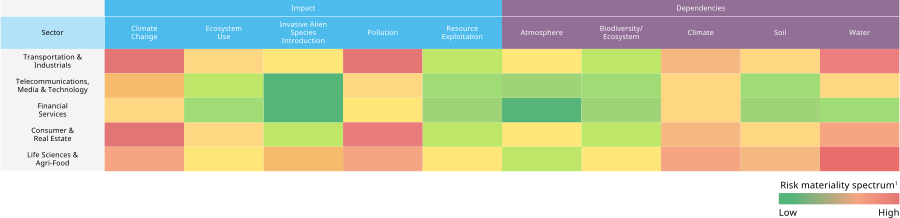
The heatmap illustrates the reliance of our portfolio on reliable and cost-effective provision of ecosystem services. Ecosystem services are essential for business activities through the supply of critical inputs, regulation of operating conditions, and cultural services. Nature loss can undermine the delivery of these services and expose companies to potential physical and transition risks.
Businesses also affect nature’s capacity to provide social and economic functions. The heatmap illustrates our portfolio’s potential direct impacts on nature, which can lead to changes in natural capital, flows of ecosystem services, and further affect different stakeholders. Companies can change the state of nature by applying pressure to the key drivers of biodiversity loss. For instance, global warming driven by the emission of greenhouse gases can affect species and ecosystems around the world, particularly vulnerable ecosystems such as coral reefs.
Our analysis2 showed that across our portfolio, the transportation & industrials and consumer & real estate sectors have both the greatest impact and dependency on natural capital and its ability to provide ecosystem services. It also highlights that pollution, climate change, and water are nature-related topics that are material to our portfolio.
The heatmap assessment provides a top-down industry view, serving as a first step in helping us understand our exposure to nature-related risk. The heatmap also informs our engagement strategies for our portfolio companies.
We are working to further advance our capability to understand our exposure to natural capital risks by leveraging physical asset location data, assessing how individual portfolio companies impact and depend on nature, monitoring the actions they are taking to mitigate their risks, and extending our analysis into their value chains.