Close
Top

Transcript: Temasek Review 2017 Media Conference

The following is a transcript of the Presentation of the 2017 Temasek Review. The text should be read in conjunction with the slides shown in this transcript. It has been edited from delivery only for readability. 

To refer to a selected transcript of the Question & Answer session which followed, click here.

To see all of the key financial metrics and diagrams in the 2017 Temasek Review, please click here.

STEPHEN FORSHAW:     
Good afternoon, ladies and gentlemen, welcome to the presentation of Temasek's annual 2017 review. My name's Stephen Forshaw, I'm going to be your MC for today. If I can just spend a couple of minutes going through some housekeeping with everyone before we start. Could I remind everyone we are under embargo until 3pm Singapore time. That is a very strict embargo, so please remember that. 

A couple of matters to let you know about in the annual review this year: all figures given, unless otherwise indicated, are in Singapore dollars and the year in review covers from 1 April 2016 to 31 March 2017, so all periods given in the review are for that period unless otherwise stated in the presentation.

Our format for this afternoon, somewhat similar to last year, we're going to open with a video presentation. We're then going to have two presenters, Sulian Tay and Mike Buchanan. I believe you've got their biographical details in front of you and their various designations. Sulian will present to you on the performance of the portfolio and Mike will present to you on the outlook and strategy.

That will then be followed by a Q&A session where Mike and Sulian will be joined by Dilhan Pillay, Chia Song Hwee and Rohit Sipahimalani. They will join on stage for your questions.

Can I ask for the question session, for the purpose of the transcript that we're doing, could you identify yourself by name and organisation and use the microphone so that we can hear you properly as well. So, they're the general housekeeping rules. Can you also perhaps turn your phones to silent so that they don't interrupt the presenters. I see everyone reaching for their phones, thank you very much.

Now, without further ado, let me introduce to you Temasek 2017: Investor, Institution and Steward.

SULIAN TAY:      
Good afternoon. My name is Sulian.

I hope you enjoyed the overview you saw in the introductory video just now. Today I will take you through a review of our annual performance. I will also share some observations on how Temasek is positioning its portfolio for sustainable growth over the long term. Then Mike will share our views on the economic and market outlook. Let me first walk you through our numbers in a bit more detail.

As you saw in the video, our net portfolio value at 31 March this year was S$275 billion. This represents an increase of S$111 billion over the decade since 2007. It is also an increase of S$33 billion since last year. Last year's result is a product of the global economic recovery and strong equity markets that affected our portfolio companies.

Our total shareholder return, or TSR, for the year was 13.37%. TSR measures the returns that we deliver to our shareholder. It includes dividends and excludes capital injections from our shareholder. This chart shows our TSR in Singapore dollars on the right hand side, over different time periods. Our 10- and 20-year TSRs were 4% and 6% respectively. And our TSR since inception in 1974 was 15%. On the left hand side, in pink, are our returns in US dollar terms using exchange rates with the Singapore dollar at 31 March.

As part of our investment discipline, we find it useful to compare our TSRs to our risk adjusted cost of capital. The blue bars are Temasek's returns while the green bars are our risk adjusted cost of capital. This is aggregated across each investment in the portfolio, on a bottoms up basis. As you can see, our long term TSRs over 30 years, 40 years and since inception have outperformed our risk adjusted cost of capital.

Last year our aggregated risk adjusted cost of capital was 7%. In part, this reflects the low interest rate environments. Our 1 year TSR of 13.37% outperformed last year's risk adjusted cost of capital. And as a result, our wealth added for the year was S$14.6 billion. As you saw in the video, wealth added is our total dollar return above our risk adjusted cost of capital.

Here I would like to discuss our 10- and 20-year TSRs. You can see that while our 10 year TSR of 4% and 20 year TSR of 6% were below our risk adjusted cost of capital, they have outperformed various indices over the same time periods.

For a fuller picture, this slide compares our TSRs to public market indices including MSCI Singapore, MSCI Asia excluding Japan, and MSCI World over various time periods. We're often asked for comparisons and this analysis serves as one frame of reference. 

Temasek has generally outperformed these indices over long time periods, particularly in Asia where we are anchored. However, it is important to realise that we are not a fund manager so we don't manage our portfolio according to public market benchmarks. Our portfolio composition is very different. In particular, we are able to take long term concentrated positions and invest in non listed assets. 

That wraps up the performance discussion. Turning now to how we have positioned our portfolio.

Last year we invested S$16 billion and divested S$18 billion. This was the first net divestment position since the year ending March 2009. Our pace of investment and divestment over the course of the year was measured and disciplined.

We continue to shape our portfolio as an active investor. We increase, maintain or decrease our holdings based on our views of intrinsic values. We look at the opportunities and challenges that may arise with each of our investments and across our portfolio.

Last year, we focussed on new value investments and deferred opportunities we thought were pricey. Our views and our actions are guided by our global outlook, our assessment of geopolitical risk and our views on equity market valuations. Mike will share some more details on our thinking on these areas shortly.

Over the past decade, we have invested over S$200 billion and divested over S$150 billion.

Our investment approach is to be agile. This enables us to seize opportunities, withstand shocks and position our portfolio for resilience and long term sustainable growth. We do this by considering both emerging and long term trends. You saw a teaser of this in the video just now, but let me spend a minute on how our portfolio has evolved over the last six years.

During this time, we increased our investments in a number of key focus areas  technology, life sciences and agribusiness, nonbank financial services, consumer and energy and resources.

These areas have grown from just 8% of the portfolio in 2011 to 24% today. They are beneficiaries of the digital economy, growing middle income populations and the needs of ageing societies.

Some examples of investments in these areas over the past year, as you saw in the video, include Ctrip and Verily Life Sciences.

To go into a bit more detail, we are also investing in growth trends for financial services. In 2011, banks represented almost all our exposure in financial services. Today, our exposure to non-bank financial services, such as insurance, payment services and financial technology, has grown to S$9 billion. This now represents one sixth of the financial services portfolio.

Likewise, for TMT, telecoms made up the vast majority of the TMT portfolio in 2011. Today, technology and media comprise more than one quarter of that portfolio, at S$17 billion. Both of these areas represent strategic shifts within a sector to rebalanced areas where we see opportunities growing.

So how have these repositioning efforts in the five focus areas affected our returns? On this slide, we show the performance of new investments in these focus areas. This is against the overall performance of our portfolio since 2011.

Our total portfolio performance is represented by the purple line. Returns on technology and non-bank financial services have outperformed our overall portfolio. Investment returns in consumer, life sciences and agribusiness are in line with portfolio performance. And while investments in energy and resources have underperformed our portfolio, they are consistent with the commodities sector globally.

As a whole, the deliberate repositioning of our portfolio over the past six years has had a positive impact on our returns.

And when you look at our three biggest holdings, Singtel is still our largest single exposure at 12%. This is followed by DBS at 5%, and China Construction Bank at 4%.

Together our top 10 holdings represent 44% of our portfolio at March 31 this year, down from 46% last year.

This diagram shows our portfolio mix by geography. This is based on the underlying assets of our portfolio companies. For example, in the case of CapitaLand the company is listed in Singapore but it also has assets in countries such as China, Vietnam and Indonesia. So, when we look at our portfolio on a geographic basis, we allocate our holdings in CapitaLand according to its assets in each of the countries it operates in.

Based on this approach to geographic mix, in 2017, Asia, including Singapore, represented 68% of our total portfolio. As you saw in the video, Singapore remains our largest country of exposure at 29%. This is followed by China and the US.

Looking at the liquidity of our portfolio, one third of our portfolio is held in liquid listed sub-20% shareholdings. Unlisted assets have grown fractionally to 40% of the portfolio. These assets are made up of positions in third party managed funds as well as privately held companies. These include both early stage companies as well as large mature ones. These assets are valued at book rather than marked to market.

Our portfolio approach allows us to deploy capital flexibly. We can take positions in public or private companies, in early or mature companies, and at various levels of concentration and we can hold our stakes for relatively long or short periods. A good example of this flexibility was practised in our investment in Alibaba in 2010, well before it became a listed company in 2014.

For our investments made since 2002, the unlisted ones have, on aggregate, delivered better returns than the listed ones.

Turning to our balance sheet. As you know, we issue debt in the market. This provides us with funding flexibility and serves as a further public marker of our credit quality. You saw some of this in the video but let me share a little more detail.

At 31 March this year, Temasek had S$12.8 billion of debt outstanding. This comprised Temasek bonds and Temasek Euro-commercial Paper. Of this debt, S$7.7 billion is due within the next 10 years. The strength of our balance sheet allows us to manage our finances for maximum flexibility.

The chart on the left references our current liquidity balance. This consists of cash and cash equivalents as well as short term investments. These assets, at 31 March, were sufficient to cover our total debt due in the next 10 years five times over.

The chart on the right references our liquid assets. These consist mainly of cash and cash equivalents, at sub 20% listed assets. These liquid assets can cover our total debt seven times over.

In summary, over the course of the last fiscal year, we continued our measured and disciplined approach to investing.

We also continued to shape and rebalance our portfolio. This is particularly so through investments in focus areas where we have seen growth opportunities arising from changes in the global economy and societal needs.

And finally, we ended the year in a net cash position. We remain fully flexible to deploy capital into new opportunities, whenever they arise.

As I hand you over to Mike, who will take you through the next part of our presentation, let me share a short video on our view of the three As of being an investor: Agility, Alignment and Accountability. Thank you.

Video: Agility, Alignment, Accountability

We had our roots in a young and transforming Singapore.

43 years on, we have grown and branched across the globe.

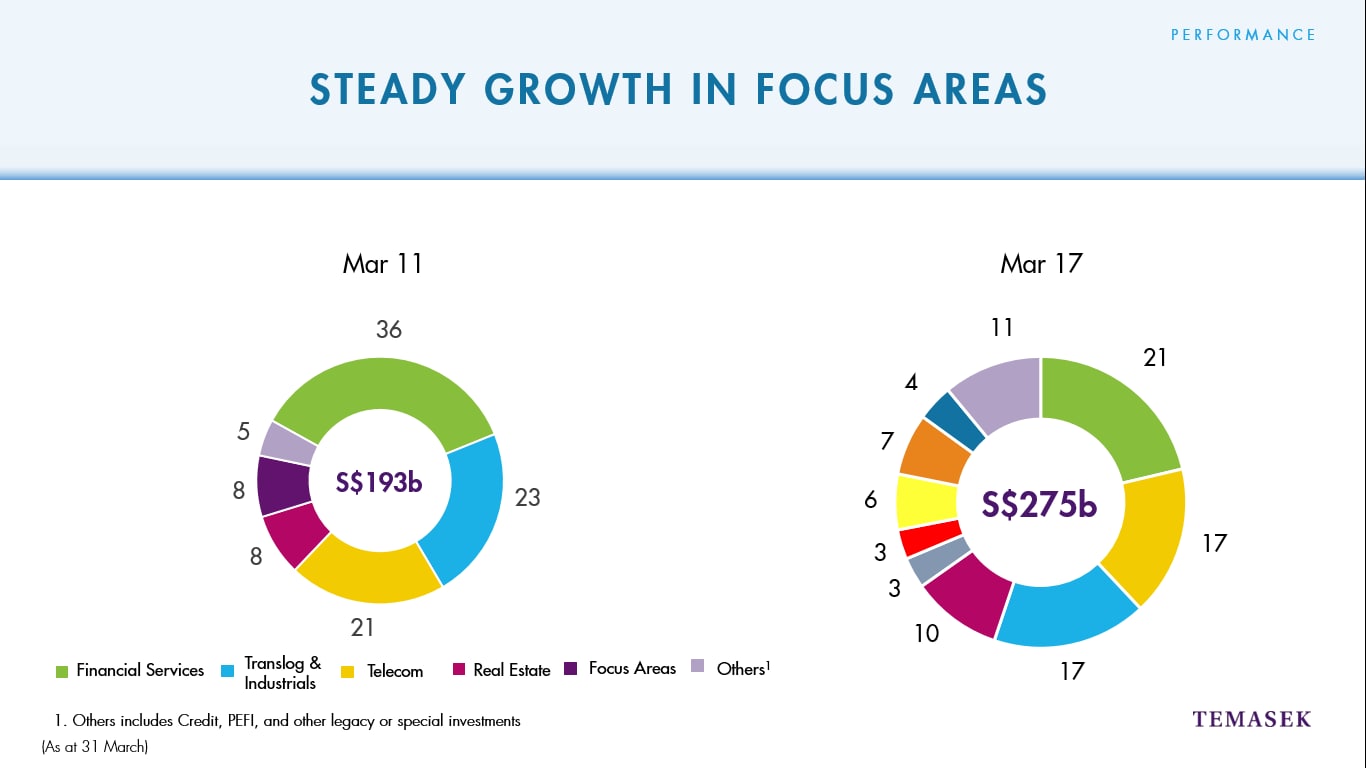
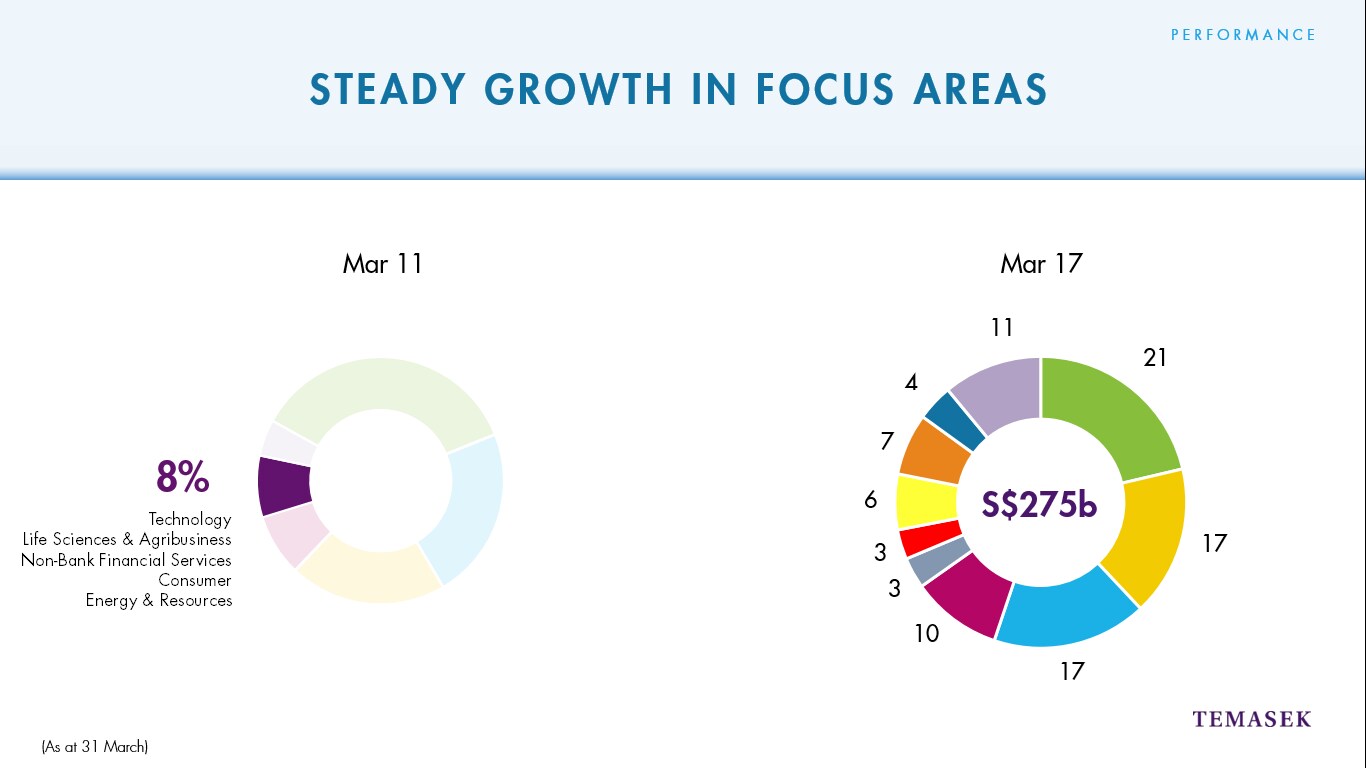
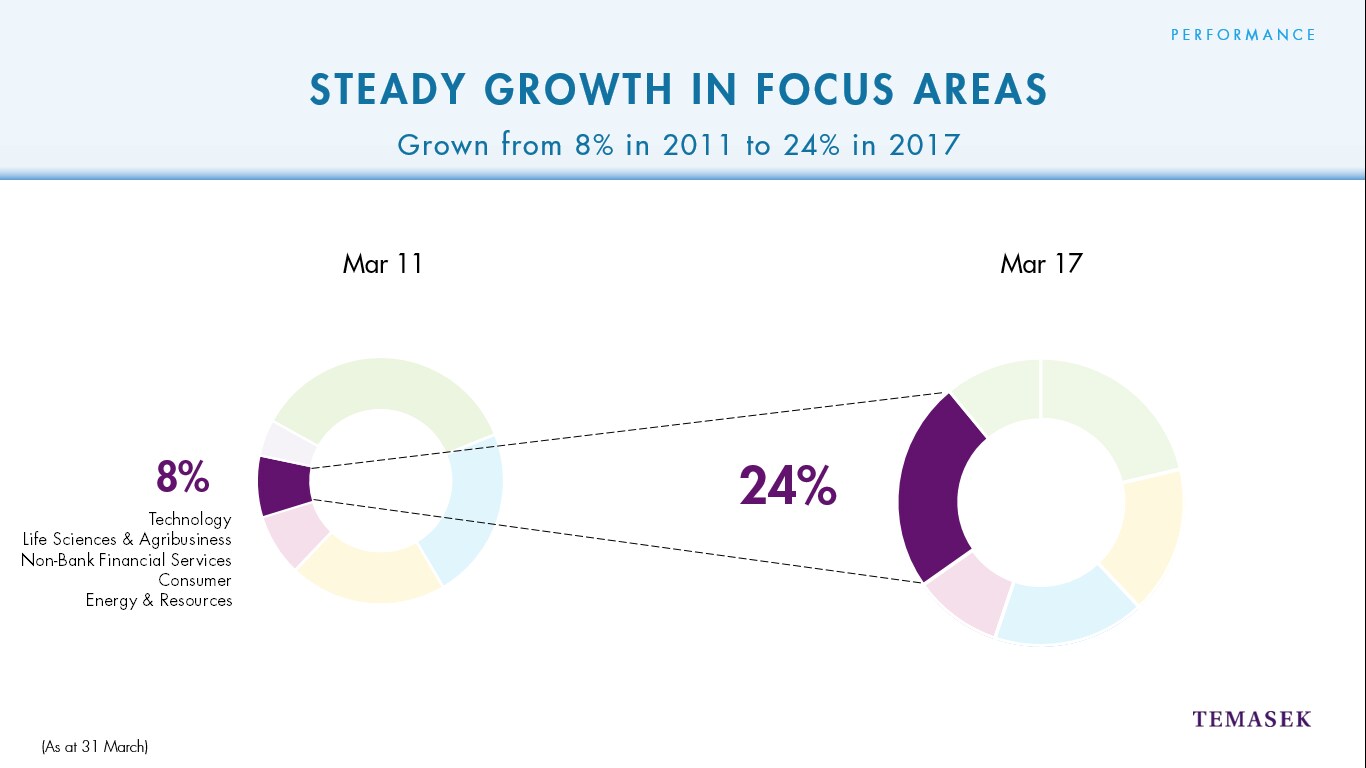
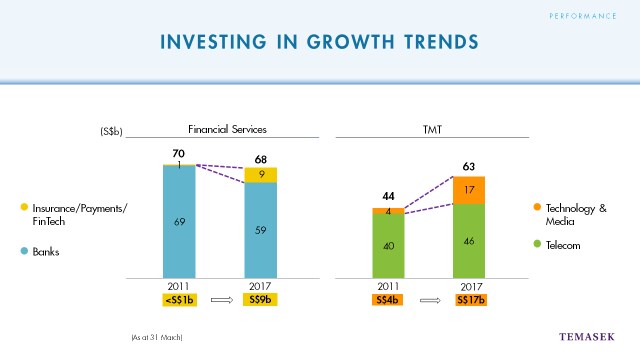
From established businesses to disruptive start-ups, we see a world of investment opportunities.

We spot trends in the unlikeliest of places and constantly reinvent ourselves to stay ahead in a changing and challenging economy.

We map our ideas, chart our own paths and align them to our long term goals by fostering a collaborative spirit.

Within and beyond Temasek.

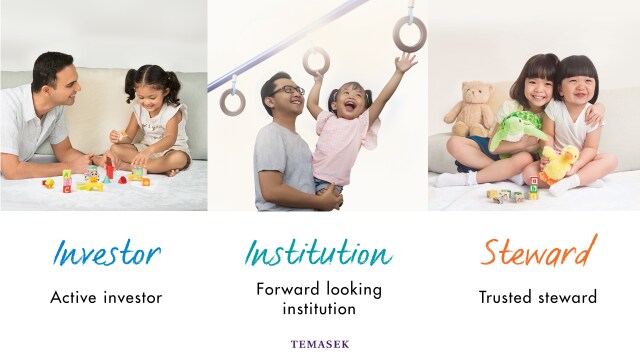
As a generational investor, we do things today with tomorrow in mind.

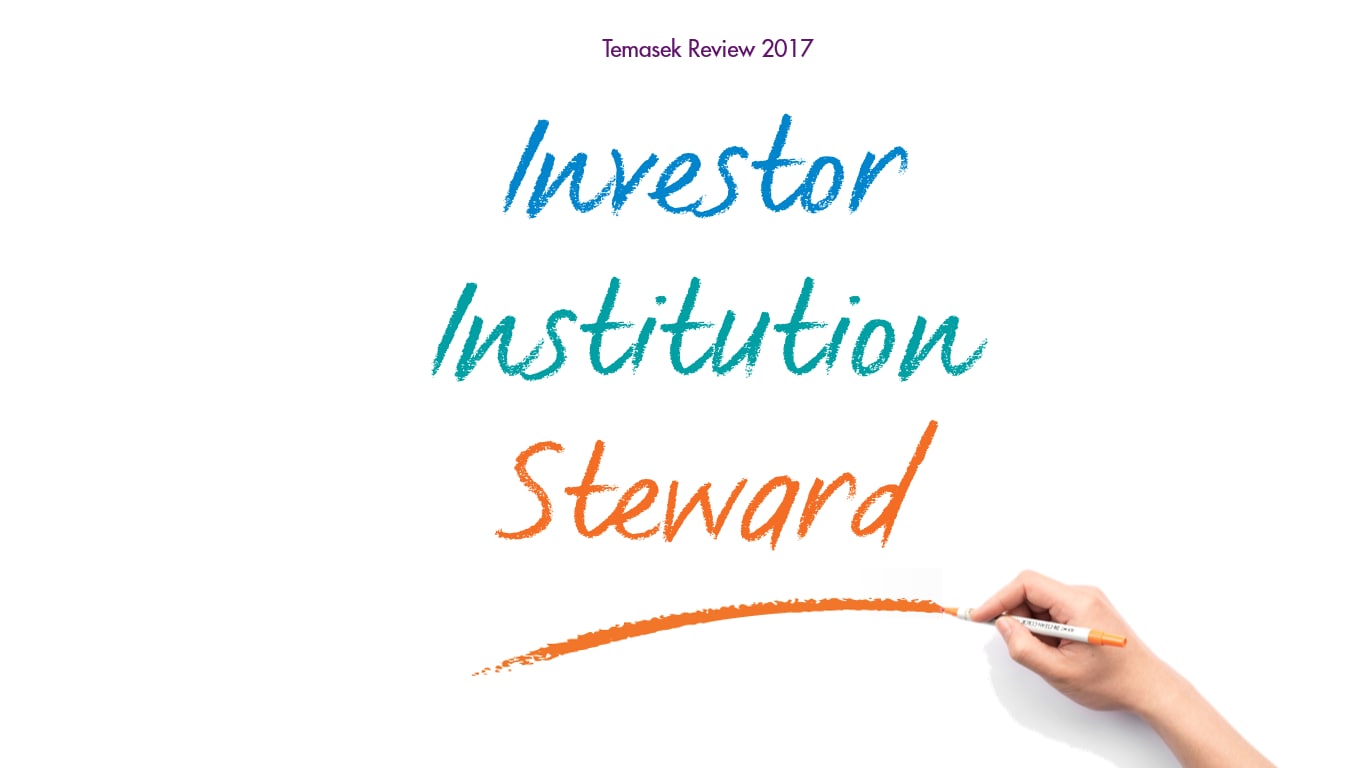
We seek to deliver sustainable value in the long run, to make a difference in what we do for our investment, our institution, and our community.

We look forward to the opportunities of tomorrow, embracing the change and all that it brings.

Anchored by agility, alignment and accountability, we invest for generations to come.


MICHAEL BUCHANAN:   
Well, thanks, Sulian and good afternoon, everyone. I'm Mike Buchanan and I will now go over our views on the economic and market outlook going forward. But first, a bit of a recap on last year.

After a challenging 2015, and a pretty difficult start to 2016, the global economy has stabilised. Economic data from most major markets have improved since the second half of 2016.

As Sulian mentioned, we adopted a measured and disciplined stance across our portfolio, recognising that these improvements in the global economy also bring with them their own set of challenges.

Where we saw increased market valuations, we took the opportunity to divest into the positive momentum of some of our holdings.

Looking ahead, we remain cautiously positive on global growth, but we're also cognisant of risks from valuations, liquidity and politics. Our agility and our ability to take a long term view will serve us well.

As we look ahead, global growth is likely to be supported by both emerging and mature economies. This positive trend may already be reflected in market valuations which now look a bit stretched. This poses risks to the returns that equity investors will be able to achieve in the future.

A gradual reduction in the abundant liquidity across global markets, combined with these stretch valuations, reinforce the need for us to maintain our disciplined posture. 

And as we continue to see pretty much every week, the world has its share of political risks, which we will continue to watch closely.

I’ll now spend a few minutes sharing some of our further thoughts around these points.

Let's take a look at each of our major markets starting with the US.

Growth there remains steady, helped by continued improvement in the labour market, which is now getting pretty close to full employment. Like other places, valuations remain above average but for now they're helped by low interest rates.

However, the Federal Reserve will continue to gradually tighten monetary policy. In any normal cycle, this brings risks to asset prices. This cycle carries with it the additional risk from the need for the Fed to reduce its balance sheet as part of the tightening. This may make it harder for the Fed to calibrate the right amount of tightening at any point in time, thus we have to remain disciplined and selective about the opportunities we pursue.

Let's take a closer look at demand in the US economy today. The US is likely to remain a mildly positive driver of the global economy. So far, this has been driven mainly by consumption but business confidence has improved and there are some possible early signs of a pickup in capital expenditure.

As you can see from the pink line, business sentiment has turned positive for the first time since 2015. That's partly because the drag from energy related investments has faded but it's still encouraging.

Related to that, we can also see that business investment has started to pick up, as shown by the blue line, for the first time since late 2014. If this continues, it will help deliver earnings growth which will help offset the impact of monetary tightening on valuations.

Next up, let's shift our focus to Europe. There has been a recent acceleration in growth to above-trend levels. This was driven by strong domestic and global demand. Going forward, the contribution from domestic demand may start to moderate just a touch.

The ECB may start to normalise its extremely accommodative monetary policy next year. Any moves can be very gradual, as core inflation is expected to remain low and so policy will remain generally accommodative.

Political uncertainty remains an issue, even after the French elections. The focus, in particular, is on the outcome of the Italian elections and we continue to watch the progress of negotiations between the United Kingdom and the European Union over Brexit for both the risks and the opportunities it provides.

Let's expand on the European data. The purple line in this chart shows the improvement in domestic demand. The green line shows credit conditions, which tells us how easily banks are able to lend to households and to companies. You can see how the loosening of credit conditions since 2013 has helped to fuel domestic demand. You can see a slight dip in credit conditions more recently. Based in part on that dip, domestic is expected to moderate a touch but still remain above trend.

More generally, not all corporates in Europe have easy access to appropriate forms of capital and this may present some opportunities for us to invest in good European companies that are looking to grow.

Now, turning to one of our largest investment destinations  China. Here, we expect growth to slow moderately as policy shifts towards managing risks in the financial sector. We think China can secure a successful rebalancing of its economy, which would mean less credit and somewhat slower but, importantly, safer growth.

An effective rebalancing will rely on the timely implementation of the Government's own reform agenda. China has made progress in some areas, including liberalising healthcare and tightening financial sector oversight. In the years ahead, we remain hopeful of further progress on fiscal, social and State owned enterprise reforms.

We continue to invest in China's economic rebalancing. Growth is increasingly driven by consumption, especially in higher productivity, new economy sectors. Private consumption remains resilient with robust growth in retail sales during the last few years.

It might be even more interesting that the fast growing online new economy sales are a particular bright spot. Online sales now account for 17% of total sales, up from 12% just two years ago.

Another promising trend is the shift towards the services sector. As China becomes richer, households are spending a smaller share of their income on essentials like food, clothes and household items and more on services such as recreation, education and healthcare. 

These trends in consumption create opportunities for us. Earlier, Sulian showed you how, across our overall portfolio, investments we've immediate in focus areas such as consumer, technology, and non-bank financial services have grown to almost a quarter of our portfolio. China exposed businesses represent good exposure to these focus areas for us.

Apart from China, other transforming economies that show promise in the medium term are India, the Philippines and Indonesia. These countries have strong reform momentum and ample policy space that gives them an improved ability to withstand, or to respond to, shocks. Reforms will help improve domestic growth and business confidence. Macro policy space allows countries to respond to negative shocks by using fiscal or monetary policy when needed.

Finally, let's turn to Singapore.

Singapore is well known for its economic openness which means it's highly responsive to global economic conditions, especially among its key trading partners. This has led to an improvement in GDP growth recently on the back of the increase in global economic activity.

Continued efforts to improve productivity and competitiveness will anchor Singapore's medium to longer term prospects.

This chart shows real growth by sectors in Singapore. Activity in our externally-orientated sectors such as manufacturing, and wholesale and retail trade, have picked up since late 2016. On the other hand, activity in domestic-orientated sectors has lagged. The contrast in growth between these sectors may be driven by some structural factors, including the more capital-intensive nature of manufacturing in Singapore, as well as the ongoing economic restructuring.

The Committee on the Future Economy laid out strategies to keep Singapore a vibrant and innovative economy. As these strategies are implemented, they will help drive domestic productivity growth as well as ensure longer term sustainable growth.

This generally benign backdrop for growth in both mature and emerging markets is helping to deliver increases in actual earnings of the corporate sector and also increases in the market's expectation of future earnings. But for equity investors, valuations are important too.

One measure of valuation is the forward price to earnings ratio based on earnings expected over the next 12 months, otherwise known as the forward PE. The low interest rates we've seen in the US and elsewhere, may have helped to push up the forward PEs globally.

On the chart, the bars represent the forward PE ratios for each market, with the blue bars representing mature markets and the orange bars for emerging markets. The green and red dots represent the maximum and minimum forward PE ratios in each individual market over the past five years.

As you can see, for most of the markets, the forward PE ratio is currently pretty close to the historical five year maximum levels, suggesting that valuations are a bit stretched relative to their recent history. Other measures also suggest that valuations are relatively high.

So what does that mean for us? It means we need to maintain our disciplined approach to both investing and divesting.

It also means we need to adhere to the drivers of our investment cycle - the four key themes you saw in the earlier video - to find growth opportunities that deliver returns over the long term.

As a long term investor, we are constantly looking for opportunities to support sustainable growth across our portfolio.

Today, our portfolio includes technology pioneers with products or business models that address sustainability related challenges. For example, Impossible Foods make burger patties out of alternative protein source, and by the way, I've had a few of their burgers, and even as a very long standing meat lover, I can tell you they taste really good!

Others, like ST Engineering with their Airbitat smart cooler, are an example of a more established company developing innovative solutions for a clean, cool Earth.

Still others pave the way in sustainable energy consumption. Cyprus Creek Renewables is a solar company that develops, builds and operates solar energy generating assets throughout the US.

Beyond our investments, we support research initiatives that improve the lives and livelihoods of our people. You saw some of those in the earlier video and we've highlighted many more across our social media channels.

The Temasek Life Sciences Laboratory and Temasek Foundation Ecosperity are two such examples of our endowments that explore bio based solutions to better the lives of those in our communities.

As I conclude this year's presentation, let me come back to the key points from this afternoon's session.

Our approach to the market environment means we took a measured and disciplined approach to the portfolio. We capitalised on opportunities to sell into the market where it made sense to do so.

We are continuing to reshape our portfolio by focussing on the areas that are positively impacted by the long term trends we expect to play out in the years ahead.

We have a cautiously positive outlook on the global economy.

We do, however, remain vigilant about the risks that are present, namely relatively high valuations, slightly tighter liquidity and various political risks in key markets around the world.

Through this, we always maintain our commitment to the three pillars of our charter being an active Investor and shareholder, a forward looking Institution, and a trusted Steward. Thank you.

Subscribe to our newsletter

Stay up to date with our latest news, insights and stories

Select a type of content
    Please select Stories you are interested in.
    Please give us your consent.
    Please confirm that you are not a robot.