Close

Portfolio Evolution

Light

Dark

A Journey of Growth:
Temasek’s Evolving Portfolio

Since our inception, Temasek has transformed from a Singapore holding company into a global investment company rooted in Singapore.

As we grew in size, we developed strategic decade-long roadmaps: T2010, T2020, and now our T2030 strategy, to guide us in building a more diversified and balanced portfolio.

Explore our portfolio's growth and evolution through the interactive chart below. The Net Portfolio Value has been restated to reflect the move to mark-to-market (MTM) reporting, except for periods prior to 31 March 2016.

Key events

Show

Hide

Scroll indicator

Partnerships, Funds, and Asset Management Companies (PFAs)

Global Direct Investments (GDIs)

Singapore-based Temasek Portfolio Companies (TPCs)

Asian Financial Crisis

Asian Financial Crisis

The Asian Financial Crisis marked a period of heightened market volatility and economic uncertainty across the region. During this time, we maintained a long-term investment approach and worked closely with our portfolio companies to navigate the challenging environment. The experience reinforced the importance of financial discipline, resilience, and a focus on sustainable value creation.

Dotcom Peak

Dotcom Peak
Dotcom Peak

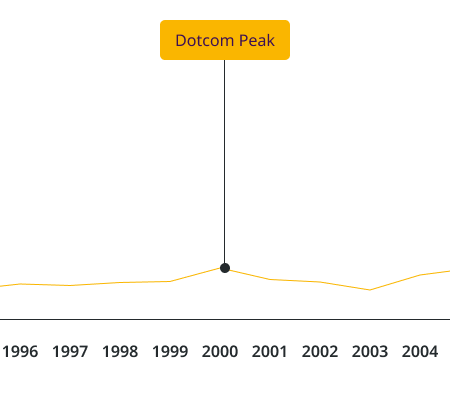
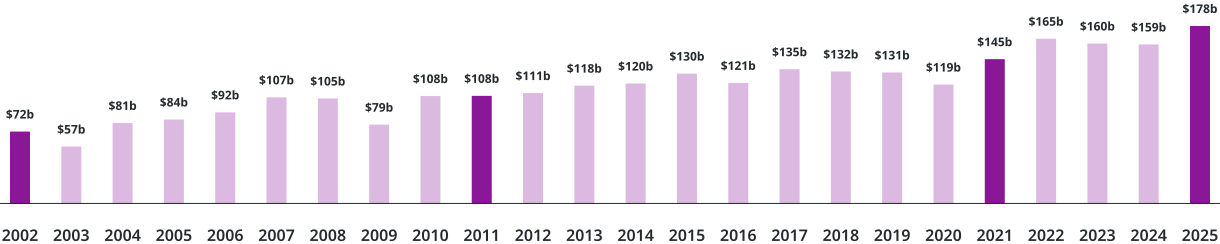
Our net portfolio value climbed to a then-record S$104 billion during the Dotcom boom, before declining in its subsequent bust.

While the Dotcom bust was not the sole trigger, it was one of several market disruptions — including the Asian Financial Crisis — that shaped our thinking around portfolio construction, risk management, and long-term positioning. The lessons learned during this time laid the groundwork for a more structured and forward-looking strategy, which would later take shape as T2010.

SARS Epidemic

SARS Epidemic
SARS Epidemic

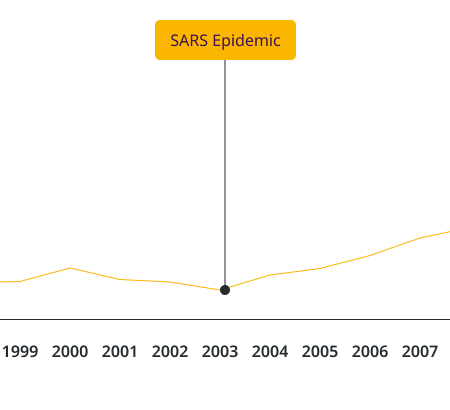
Our investment activity slowed during 2003, partly due to the SARS crisis which impacted Asian economies, more significantly in the transport and tourism/leisure industries. Investment levels between 2003 and 2004 dipped, with just S$3.3 billion invested in 35 companies. However, by 2005, new investments — mostly in Asia — had jumped to almost S$13 billion.

Global Financial Crisis

Global Financial Crisis

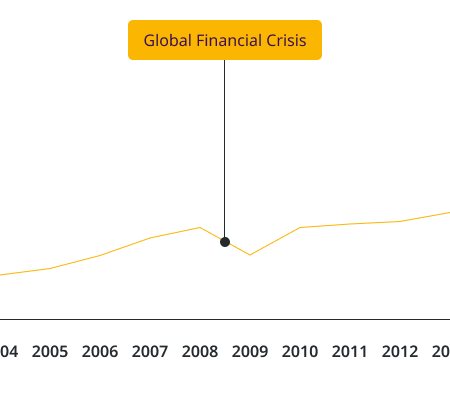
The Global Financial Crisis from 2007 to 2008 led to Temasek’s net portfolio value dropping by over S$50 billion to S$130 billion in the financial year ending March 2009. As markets recovered in 2010, our net portfolio value rebounded to S$186 billion in the financial year ending March 2010.

Market dislocation

Market dislocation
Market dislocation

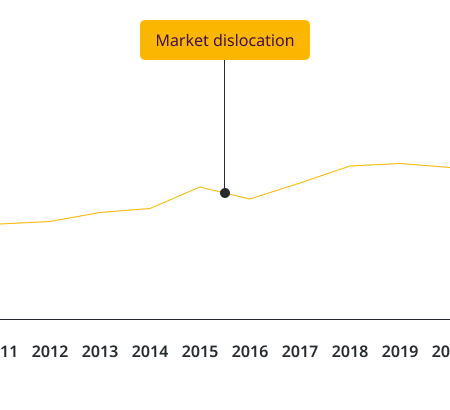
We experienced a decline in our net portfolio value in 2016, marking the first drop since the Global Financial Crisis in 2008. The 2010s-2020s saw major challenges such as European debt crisis, China stock market sell-off, US-China trade tensions, and COVID-19 which led to signficant market disruption.

We continued to reshape and rebalance our portfolio towards longer term trends and maintained an investment stance that is disciplined but nimble to capitalise on opportunities and withstand shocks.

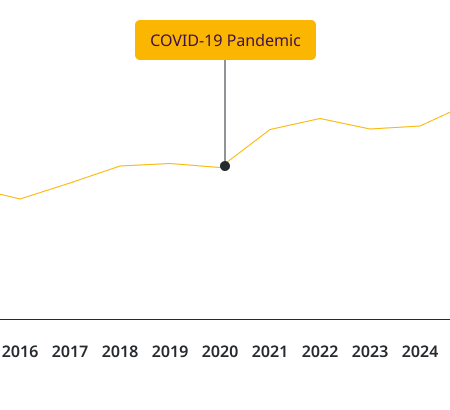
COVID-19 Pandemic

COVID-19 Pandemic

The COVID-19 pandemic triggered another wave of global disruption. Temasek’s portfolio experienced a dip in value as markets reacted to uncertainty and lockdowns. Despite the volatility, Temasek entered the crisis in a strong net cash position and responded swiftly — supporting portfolio companies in maintaining operations, protecting jobs, and adapting to new realities.

We also accelerated investments in long-term structural trends that have shaped our investment focus — particularly Digitisation and Sustainable Living. These trends, along with Future of Consumption and Longer Lifespans, continue to guide our portfolio construction. We invested in companies developing innovative solutions to address global challenges and growing societal needs, deepening our exposure to the technology, financial services, industrials, and energy sectors.

We bounced back with strength in 2021, achieving a record net portfolio value of S$381 billion — a S$75 billion increase over the previous year, reflecting our resilient portfolio and commitment to long-term impact.

Singapore-based Temasek Portfolio Companies (TPCs): Stalwarts of Our Portfolio

NPV Chart

1Net Portfolio Value figures from the financial year ended 31 March 2016 onwards have been restated to value our unlisted investments on a mark-to-market basis.

Our TPCs are core investments in Singapore-based companies in which we typically hold a shareholding interest of at least 20%. They are stalwarts of our portfolio that deliver stable and good sustainable returns over the long term.

Several of these companies provide essential services and infrastructure in Singapore. Many TPCs have also established themselves as globally competitive businesses holding leading positions in their respective industries.

In 2002, TPCs made up 94% of our portfolio. As at 31 March 2026, they account for 43% of our portfolio and have delivered annualised returns of 8.1% over the past 10 years. Together, they have an aggregate revenue of approximately S$200 billion, and employ more than 400,000 people globally.

Discover how we’re partnering our TPCs to build long-term value, drive sustainable growth, and foster meaningful change for people and the planet.

Our stories

Lorem ipsum dolor, sit amet consectetur adipisicing elit. Voluptas nesciunt explicabo odit, laudantium officia in, non eligendi architecto temporibus placeat sunt excepturi commodi. Dolor fuga porro deleniti explicabo iste excepturi?

Lorem ipsum dolor Lorem ipsum

Lorem ipsum dolor

Lorem ipsum dolor

Lorem ipsum dolor

Lorem ipsum dolor

Lorem ipsum dolor

Lorem ipsum dolor

Global Direct Investments (GDIs): Investing in Emerging and Established Market Leaders

NPV Chart

1Net Portfolio Value figures from the financial year ended 31 March 2016 onwards have been restated to value our unlisted investments on a mark-to-market basis.

Our GDIs primarily comprise public and private equity investments in emerging and established market leaders. These investments are aligned to four structural trends — Digitisation, Sustainable Living, Future of Consumption, and Longer Lifespans — which are interconnected, transcend sectors and countries, and persist through economic cycles.

We have the flexibility to invest across a broad opportunity set spanning minority equity positions, co-investments, public markets, and selective control transactions.

From 4% of our portfolio in 2002, our GDIs have grown to 38% as at 31 March 2026 and delivered annualised returns of 7.6% over the past 10 years. This segment has contributed to diversifying our portfolio, capturing growth across markets, and delivering good sustainable returns over the long term.

Partnerships, Funds, and Asset Management Companies (PFAs): Scaling capital and accessing specialised strategies

NPV Chart

1Net Portfolio Value figures from the financial year ended 31 March 2016 onwards have been restated to value our unlisted investments on a mark-to-market basis.

Our PFAs comprise partnerships with other investors; private equity funds, private credit, and impact investments; and our asset management companies. They enable us to tap on a broad range of opportunities by collaborating with industry leaders to offer and scale capital solutions such as private equity, private credit, and tailored financing options.

From around 2% of our portfolio in 2002, PFAs have grown to 19% as at 31 March 2026, and have delivered annualised returns of 7.7% over the past 10 years.

We are invested in a high-quality portfolio of funds diversified across geographies, sectors, and vintages. Our asset management companies (AMCs), through Seviora Holdings, our main Asset Management Platform, are a key pillar of our PFA strategy. They provide a breadth of offerings across public and private market strategies, and deliver multi-asset, multi-strategy exposure tailored to evolving investor needs across risk profiles and geographies, particularly in Asia and adjacent markets.

Our AMCs also include others such as 65 Equity Partners, Aranda Principal Strategies, Decarbonization Partners, and True Light Capital.

Mark-to-market basis portfolio reporting

NPV Chart

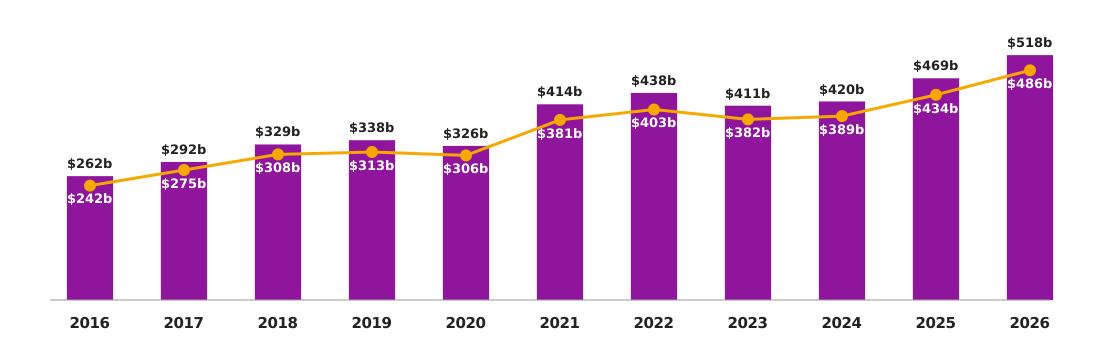
NPV on a mark-to-market basis

NPV based on valuing unlisted investments at book value
and listed investments at market prices

We have fully transitioned to an MTM basis for our portfolio reporting as this provides a consistent valuation basis for our unlisted investments that are held across different holding structures. MTM reporting enhances our risk management, performance measurement, and investment decision-making, and aligns us with global peers.

It also gives a more representative view of the current value of our portfolio and better reflects its risks and volatility.

Approximately 75% of our portfolio has already been valued on an MTM basis, with listed investments valued at market prices, and unlisted funds and co-investments1 marked to market. We have been disclosing the value uplift from marking the remaining 25% of our portfolio to market since 2022.

For the year ended 31 March 2026, marking to market the remaining 25% of our portfolio provides an uplift of S$32 billion, compared to reporting based on book value2. This uplift is principally from our large unlisted Singapore positions.

Over longer periods, there is no meaningful difference between TSRs calculated using the two methods.

1General Partner-managed fund investments and co-investments, where underlying investments are valued on an MTM basis.

2Book value refers to Temasek's cost of investment plus our share of the investee company's profits or losses, changes in other equity reserves, minus write-downs (if any).

Subscribe to our newsletter

Stay up to date with our latest news, insights and stories

Select a type of content
    Please select Stories you are interested in.
    Please give us your consent.
    Please confirm that you are not a robot.